Optimizing the Loans to Deposits Ratio: A Guide for Bank Executives
Brian's Banking Blog
The loans to deposits ratio is a fundamental metric in banking—a clear, concise indicator of how effectively an institution is deploying its core funding into interest-earning assets. At a glance, it quantifies the critical balance between loan-driven profitability and the imperative of maintaining sufficient liquidity to satisfy depositor obligations and regulatory expectations.
Why the Loans to Deposits Ratio Demands Executive Attention
For bank executives and directors, the loans to deposits (LTD) ratio is far more than a figure on a quarterly report; it is a direct reflection of the bank's strategic posture. This single percentage captures the inherent tension between using capital to drive growth and preserving liquidity. It is a powerful lens through which to view your institution's risk appetite, operational efficiency, and overall market strategy.
At its core, the LTD ratio measures a bank's performance in its primary function of financial intermediation—converting deposit liabilities into productive loans. Every dollar held in liquid reserves is a dollar not generating maximum return, yet every dollar loaned out introduces credit and liquidity risk. Navigating this trade-off is the central challenge of modern banking, particularly in a volatile economic climate.

A Strategic Balancing Act
A high ratio is not inherently superior to a low one; each reflects a distinct strategic choice with its own risk-reward profile. A precise understanding of this dynamic is critical for making informed decisions that align with board-level objectives.
- High LTD Ratio (e.g., 95%): This indicates an aggressive, profit-oriented strategy. By deploying a high percentage of its deposit base into loans, the bank is maximizing its interest-earning assets, which can significantly boost its net interest margin (NIM). The trade-off is a minimal liquidity buffer, creating vulnerability to sudden deposit outflows or a credit market seizure.
- Low LTD Ratio (e.g., 70%): This suggests a conservative, liquidity-focused approach. Ample liquidity provides a strong defense against market shocks and ensures depositor demands can be met without stress. However, this safety comes at the cost of potential inefficiency and forgone revenue, as excess cash sits idle rather than generating returns for shareholders.
Consider this scenario: A bank with $1 billion in deposits and $950 million in loans operates with a 95% LTD ratio. Its profitability may appear strong. However, a mere 5% contraction in deposits, if not matched by a reduction in the loan portfolio, could trigger a severe liquidity crisis, forcing the bank to seek high-cost wholesale funding and eroding its net interest margin.
Managing this balance effectively is not a matter of intuition; it requires sharp, timely data intelligence. Executives need to know how their LTD ratio compares to true peers, how it is trending, and what specific loan and deposit activities are driving its movement. This is the point where raw data transforms into strategic foresight.
To outperform in today's market, leadership must move beyond static, rearview-mirror analysis. Proactive monitoring of your loans to deposits ratio allows for real-time strategic adjustments. The first step is to benchmark your performance. Understanding your position relative to the market is the fastest way to identify opportunities for optimizing your balance sheet for both safety and profitability.
Calculating and Interpreting the LTD Ratio
The formula for the loans to deposits ratio is straightforward: Total Loans divided by Total Deposits. However, the strategic value lies not in the calculation itself, but in a granular understanding of what those two line items truly represent. For executive decision-making, this means dissecting the components that constitute your bank's primary assets and liabilities.
- Total Loans: This figure represents the gross value of all loans on the institution's books, including commercial, consumer, and real estate portfolios. Critically, this is the value before deducting the allowance for loan and lease losses (ALLL).
- Total Deposits: This encompasses all deposit liabilities, from non-interest-bearing demand accounts and savings to money market accounts and certificates of deposit (CDs).
A key nuance for executives to monitor is the composition of these deposits. A heavy reliance on non-core funding, such as brokered deposits, can distort the picture. While they are included in total deposits, their volatility and higher cost can mask underlying liquidity risks that a surface-level LTD ratio would not reveal.
From Calculation to Strategic Insight
An LTD ratio of 85% is not merely a number; it is a declaration of strategy. It signifies that for every dollar of deposits gathered, 85 cents are deployed into the loan portfolio. This single metric provides a clear, quantifiable measure of the institution's position on the risk-reward spectrum.
Consider two institutions with divergent approaches:
Bank A operates with an aggressive 92% LTD ratio. This strategy is explicitly geared toward maximizing profitability. By channeling the vast majority of its deposit base into higher-yielding loans, the bank is likely achieving a strong net interest margin. However, this high-wire act leaves minimal room for error, exposing the bank to significant risk should deposit outflows accelerate or credit markets tighten.
Bank B, conversely, maintains a conservative 68% LTD ratio. This "fortress balance sheet" approach prioritizes liquidity above all else. With a substantial portion of its deposits held in cash or low-yield securities, the bank is well-insulated from market shocks. The strategic cost is the potential for underperformance and questions from shareholders about whether capital is being deployed effectively.
The "ideal" loans-to-deposits ratio is not a static figure but a dynamic target. It must be continuously recalibrated based on the institution's strategic plan, the prevailing economic environment, and the board-approved risk appetite.
This is precisely why a static, quarterly report is insufficient. To make this metric truly actionable, leadership needs to see the trend lines and understand the interplay between loan and deposit growth. For a deeper analysis of these dynamics, review our brief on what your loan and deposit activity really reveals.
Data intelligence tools like Visbanking are engineered for this purpose, transforming raw call report data into a clear strategic dashboard. This empowers executives to move beyond simple arithmetic and engage in more sophisticated conversations about active balance sheet management. The goal is to make the LTD ratio a metric that is deliberately steered, not merely reported.
By benchmarking your institution against a curated peer group, you gain the necessary context to make confident, data-driven decisions. An LTD ratio that appears high or low in isolation may be perfectly aligned with peer institutions of a similar size, geographic footprint, and business model. This is where data moves from being noise to being a catalyst for action.
The High-Wire Act: Balancing Profitability and Liquidity Risk
The loans to deposits (LTD) ratio is the fulcrum of banking strategy, forcing a continuous trade-off between the pursuit of profit and the preservation of a robust liquidity safety net. Every basis point change in this ratio represents a conscious decision to either deploy assets for income generation or hold them in reserve for protection.
Increasing the LTD ratio is a direct lever for enhancing profitability. Deploying a larger portion of low-cost core deposits into higher-yielding loans directly expands the net interest margin (NIM)—the primary driver of shareholder returns. However, this aggressive posture is not without significant and tangible risks.
The Dangers of an Aggressive Loan Strategy
A high LTD ratio introduces critical vulnerabilities that must remain on the board's radar. These are not theoretical textbook risks; they are active threats that can escalate rapidly in an economic downturn.
- Vulnerability to Deposit Flight: A high LTD ratio signifies minimal operating cushion. An unexpected acceleration in deposit withdrawals can trigger a significant liquidity crunch, forcing the institution into costly, last-resort funding options.
- Dependence on Expensive Funding: Once core deposits are fully deployed, further loan growth must be funded by more expensive sources, such as wholesale funding or FHLB advances. This progressively erodes the very margin the strategy was designed to expand.
- Heightened Regulatory Scrutiny: Regulators view a persistently high LTD ratio as a primary indicator of elevated liquidity risk. As a bank's ratio approaches 100%, it can expect increased supervisory attention and potential demands for corrective action.
Illustrative Case: A $2 billion community bank pursues a strategy to boost its NIM by pushing its LTD ratio to 95% during a period of low interest rates. When a regional economic downturn triggers unexpected deposit outflows, the bank faces a sudden liquidity crisis. It is forced to borrow from the FHLB at punitive rates, erasing prior gains and damaging its reputation.
This scenario highlights the core challenge: a strategy intended to enhance performance becomes its greatest vulnerability. This underscores why strong bank liquidity management is not a back-office compliance function but a central pillar of strategic planning.
Using Data to Navigate the Trade-off
The objective is not to fear a higher LTD ratio but to manage it with precision. This requires a shift from static, quarterly reviews to dynamic, data-driven oversight. A platform like Visbanking empowers leadership to monitor the LTD ratio in near-real-time, identifying the subtle trends in loan origination and deposit gathering that drive the metric.
This chart illustrates a common scenario: a bank’s LTD ratio trends upward over three quarters as loan growth consistently outpaces deposit inflows.
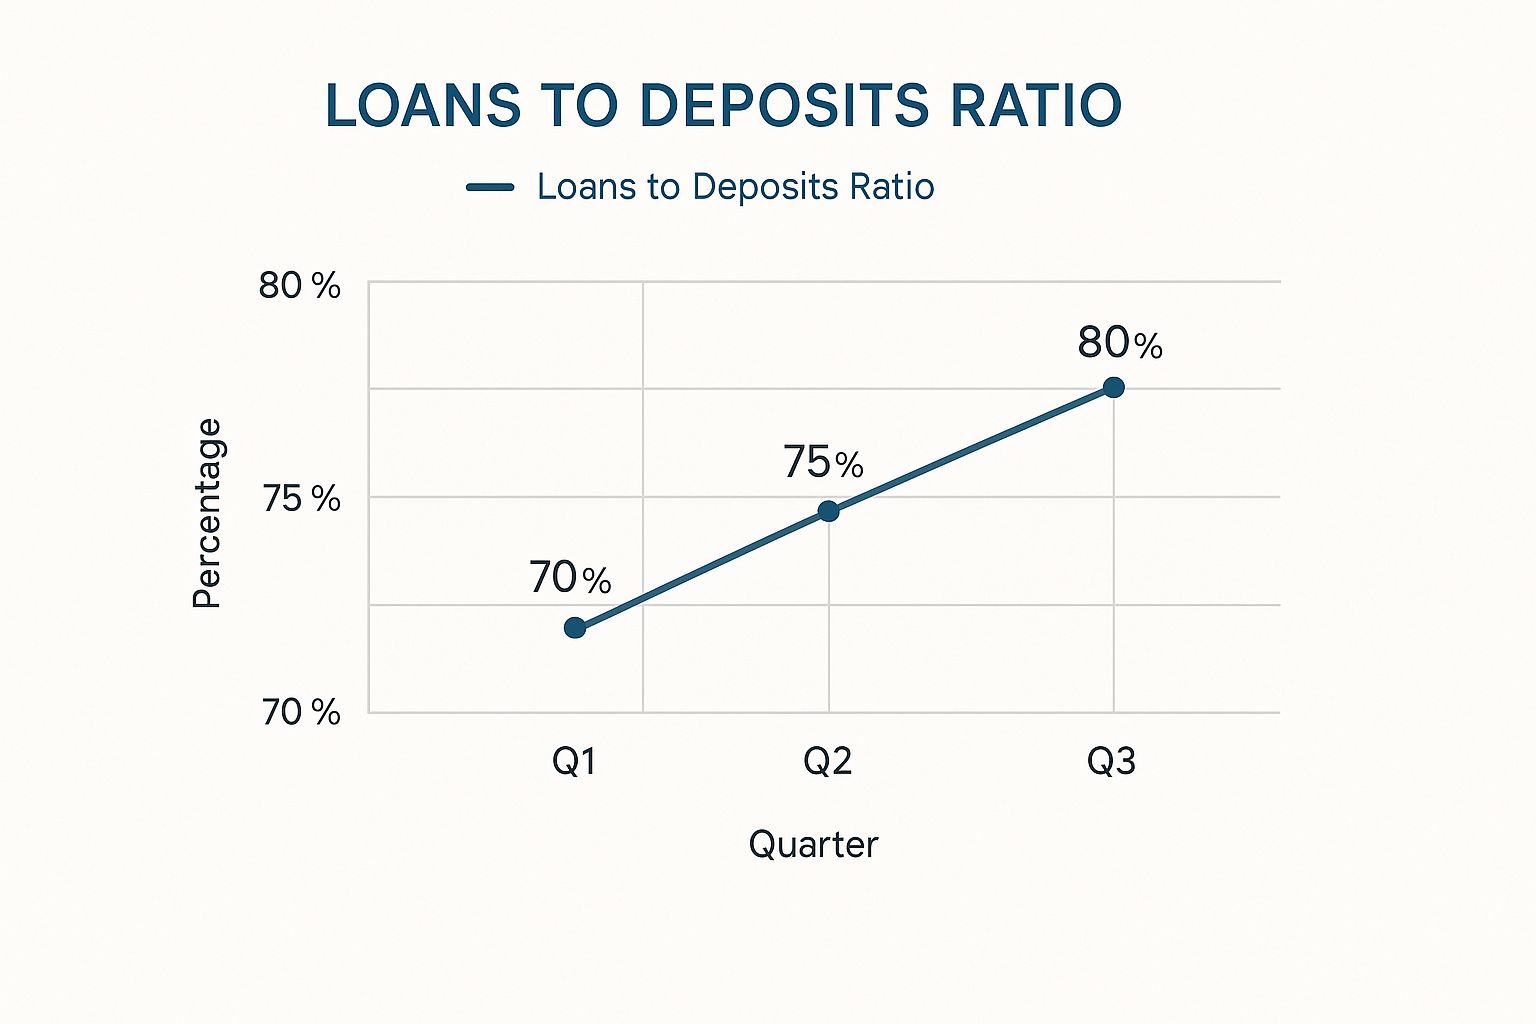
A clear visual trend like this, showing a climb from 70% to 80%, is an immediate call to action. It should prompt critical questions at the executive level: Is this increase intentional? Is our deposit-gathering strategy underperforming? How does this trend compare to our peers?
Loans to Deposits Ratio Impact on Key Performance Indicators
The LTD ratio does not exist in a vacuum. Its movement has a direct and often immediate effect on a bank's most critical performance indicators. The following table outlines the strategic trade-offs, illustrating how a low versus high ratio influences key metrics from profitability to risk exposure.
| Metric | Low LTD Ratio (e.g., 65%) | High LTD Ratio (e.g., 90%) |
|---|---|---|
| Net Interest Margin (NIM) | Lower; more low-yield liquid assets | Higher; more high-yield loans deployed |
| Liquidity Position | Strong; ample cash to meet obligations | Weaker; less buffer for deposit outflows |
| Reliance on Wholesale Funding | Low; primarily funded by core deposits | High; may need FHLB or brokered funds |
| Regulatory Scrutiny | Low; viewed as conservative and safe | High; seen as a primary liquidity risk indicator |
| Shareholder Return | Potentially lower due to suppressed NIM | Potentially higher, but with increased risk |
As illustrated, there is no single "correct" balance; the optimal position is determined by the institution's specific strategy and risk framework.
With the right data tools, leadership can analyze these trends with greater depth. You can discern whether deposit growth is driven by stable core relationships or volatile "hot money," allowing for strategic adjustments before a concerning trend becomes a material risk.
By converting raw numbers into clear, forward-looking insights, you can shift from reacting to the LTD ratio to actively managing it. The objective is to make it a strategic dial that can be adjusted with confidence, not just a number to be reported.
How Macroeconomic Forces Shape Your LTD Ratio
A bank's loans-to-deposits ratio is not determined in isolation. It is subject to powerful external forces, primarily driven by interest rate cycles and Federal Reserve policy. For forward-thinking bank leadership, understanding these macroeconomic headwinds and tailwinds is not merely academic—it is essential for strategic planning and risk mitigation.
When the Federal Reserve initiates a tightening cycle, the competition for deposits intensifies immediately. Sophisticated customers and corporate treasurers seek higher yields, moving funds from standard deposit accounts to higher-paying alternatives like money market funds or Treasury bills. This can lead to a contraction in a bank's deposit base, shrinking the denominator of the LTD ratio and mechanically driving the metric higher.
Conversely, a rate-cutting cycle can flood the system with liquidity. In such an environment, deposit growth may accelerate while loan demand cools, potentially pushing the LTD ratio downward.

The Cyclical Nature of Loans to Deposits
The relationship between the LTD ratio and the economic cycle is both predictable and recurring. The mark of a well-run institution is its ability to anticipate these shifts and adjust its strategy proactively.
Historical data demonstrates that LTD ratios move in concert with interest rates and broader economic conditions. An analysis of U.S. banks with assets under $10 billion reveals a clear pattern: as interest rates rise, LTD ratios tend to follow. This is driven by two primary factors: higher rates can slow deposit growth while simultaneously incentivizing banks to increase lending to capitalize on wider spreads, thus pushing the ratio up.
Understanding how these macro forces influence specific loan categories, such as investor loan interest rates, is critical for anticipating shifts in loan demand and the resulting impact on your LTD ratio.
Executive Takeaway: View your LTD ratio as a mirror reflecting both internal strategy and the external financial climate. Ignoring the macroeconomic forecast is equivalent to navigating a storm without radar—an unacceptable risk for any financial institution.
From Macro Trends to Micro Actions
Identifying macroeconomic trends is the first step. The critical work lies in translating that high-level understanding into specific, tactical actions. As rates begin to climb, the strategic playbook must adapt swiftly.
- Defend the Deposit Base: This becomes the immediate priority. It may necessitate launching competitive CD specials or enhancing relationship pricing for key clients to prevent deposit attrition.
- Re-evaluate Loan Pricing: As funding costs rise, loan pricing must adjust in tandem to protect the net interest margin.
- Monitor Peer Behavior: Track how competitors are responding. Are they aggressively raising deposit rates? Are they pulling back from certain lending categories?
This is where a data intelligence platform like Visbanking becomes a strategic necessity. It enables leadership to move from simply reading financial news to seeing its direct impact on their institution and its competitors in near-real-time. You can track peer deposit offerings, benchmark loan growth, and model the impact of various rate scenarios on your own balance sheet. The link between macro events and your bottom line is direct and measurable; you can explore the impact of interest rates on bank profitability to prepare for future shifts.
Ultimately, mastering the LTD ratio in a dynamic economy requires a proactive, not reactive, mindset. By using precise data to understand how macroeconomic forces affect your bank at a granular level, you empower your leadership team to make smarter, faster decisions that protect the institution while capitalizing on emerging opportunities.
Benchmarking Your LTD Ratio Against True Peers
Analyzing your loans to deposits ratio in isolation provides an incomplete and potentially misleading picture. To transform this metric into actionable strategic intelligence, it must be benchmarked against the right competitors. Relying on a broad national average is a flawed approach that can lead to misguided strategic decisions.
A $2 billion commercial bank in the Midwest operates in a fundamentally different context than a $50 billion retail-focused institution on the East Coast. They face different economic pressures, serve different clienteles, and employ different business models. A direct comparison of their LTD ratios is an apples-to-oranges exercise that yields no practical insight.
True strategic insight emerges only from comparison against a carefully curated peer group.
Defining Your Real Competitive Landscape
Effective benchmarking requires the creation of a custom peer group. This is not about selecting banks that validate a preconceived notion; it is about constructing a cohort that accurately reflects your institution's operating reality. Data intelligence platforms are indispensable here, providing the capability to segment the entire banking industry to identify your true competitors.
A meaningful peer group should be defined by several key characteristics:
- Asset Size: An institution's size dictates its operational complexity, lending capacity, and regulatory framework.
- Geography: Local and regional economic conditions directly influence both loan demand and deposit stability.
- Business Model: A lender with a concentration in commercial real estate has a vastly different risk profile and funding strategy than a bank focused on small business lending or residential mortgages.
Only when you measure your LTD ratio against a group that mirrors these attributes can you obtain an accurate assessment of your relative performance.
From Data to Decisive Action
With a custom peer group established, the data begins to yield strategic intelligence. A significant variance between your LTD ratio and the peer average is a powerful signal demanding board-level attention. It directly indicates whether your strategy is aligned with or diverging from competitors facing the same market conditions.
Consider a $3 billion community bank that discovers its LTD ratio is 75%, while its custom peer group average is 85%.
That 10-point gap is not just a data point; it is a strategic flag. It compels leadership to ask critical questions: Are we being overly conservative in our lending? Is our loan pipeline underperforming? Or are our competitors assuming a level of risk that we deem imprudent?
Conversely, an LTD ratio that is 15 points above the peer average (95% vs. 80%) is an even more urgent signal. It suggests you may be a significant outlier on risk. While it could indicate superior performance, it more likely signals an over-reliance on volatile funding or an aggressive lending posture that could prove vulnerable in a downturn.
Over the past decade, the U.S. banking system has experienced significant liquidity shifts. According to the Federal Reserve's recent report, the industry-wide LTD ratio stood at 70% as of April 2023. This was a substantial increase from 61% a year prior, driven largely by a $960 billion decrease in deposits. Yet, this figure remained below the 10-year average of 72%, indicating that balance sheets had not fully reverted to historical norms.
This is precisely how modern data intelligence transforms raw data into a strategic roadmap. It allows you to move beyond generic national statistics and ask sharp, specific questions about your bank's performance relative to your true competitors. With a platform like Visbanking, these custom peer groups can be constructed in minutes, converting benchmarking from a laborious, manual process into a dynamic, strategic tool.
Putting a Plan in Place to Steer Your LTD Ratio

Monitoring the loans to deposits (LTD) ratio cannot be a passive, quarterly exercise. It must be an active, ongoing component of executive management. This metric represents one of the most powerful levers for steering both risk and profitability. The imperative is to shift from observing the ratio to managing it with strategic intent.
An effective management plan is not about making drastic, reactive adjustments. It is about implementing a series of precise, deliberate actions on both sides of the balance sheet. This proactive approach is a key differentiator between market-leading institutions and those that merely react to market forces.
Mastering Your Balance Sheet's Levers
To effectively manage your LTD ratio, you must be able to influence both loan volume (the numerator) and deposit levels (the denominator). The key is to apply strategic pressure, not to make abrupt changes that could disrupt business.
Consider a $1.5 billion institution whose LTD ratio has climbed to 93%, significantly above its peer average of 84%. The board is expressing concern over liquidity risk. The leadership team must develop a plan with clear, measurable actions.
Managing the Loan Portfolio (The Numerator):
- Refine Underwriting Standards: Modestly tighten credit criteria for higher-risk loan categories, such as speculative commercial real estate or unsecured consumer credit. This can temper new loan growth without halting origination.
- Adjust Loan Pricing: A marginal increase in interest rates can be sufficient to moderate loan demand. A 25-basis-point adjustment on specific loan products can help align loan growth with deposit flows.
Managing the Deposit Base (The Denominator):
- Launch Targeted Campaigns: Instead of a costly, across-the-board rate increase, focus on specific segments. Launch a campaign to attract stable municipal deposits or high-value operating accounts from local businesses.
- Incentivize Relationship Deepening: Offer preferential rates on both loans and deposits to clients who consolidate their financial relationships with your institution. This fosters a more loyal, "sticky" deposit base.
A common strategic error is to pursue "hot money" via high-rate CDs to rapidly decrease the LTD ratio. While this provides a short-term fix, it erodes margins and increases funding volatility. A patient, surgical approach focused on growing core deposits is the superior long-term strategy.
Why Data Intelligence Is No Longer Optional
These strategies are only as effective as the data that informs them. This is where modern data intelligence transitions from a beneficial tool to an essential component of executive management. Relying on static, lagging reports is akin to driving while looking only in the rearview mirror.
An effective data intelligence system must provide:
- Continuous Monitoring: The ability to track your LTD ratio and its drivers on a daily or weekly basis, not just quarterly.
- Real-Time Alerts: The capability to set a target range—for instance, 82% to 88%—and receive an automatic alert the moment the ratio moves outside this corridor.
- Deep-Dive Analysis: When a change occurs, you need to understand the why immediately. Was it a single large commercial depositor, or a broader outflow of retail savings?
This level of insight transforms boardroom conversations from "What happened?" to "Here is our plan." It empowers leadership to anticipate challenges and act with data-backed confidence.
It is time to move beyond static reporting and embed dynamic data intelligence into your core strategy. By continuously monitoring your metrics against true peers and understanding the narrative of your balance sheet, you can protect your institution and drive superior performance. See how Visbanking can deliver the clarity you need to make those decisive moves.
Let's Clear Up Some Common Questions About the LTD Ratio
In strategic discussions at the executive and board level, the loans to deposits ratio is a recurring and critical topic. Despite its simple construction, its strategic application is often nuanced. Here are answers to some of the most pressing questions from bank leaders.
What Constitutes a "Good" LTD Ratio?
While a range of 80% to 90% is often cited as a benchmark, there is no universally "good" LTD ratio. The optimal ratio is specific to an institution's strategic objectives, board-approved risk appetite, and the prevailing economic conditions.
A conservative, liquidity-focused bank may target a ratio around 75%, willingly forgoing some potential profit for a larger safety buffer. In contrast, an institution in an aggressive growth phase might strategically operate with a ratio above 90%, accepting the associated liquidity risk in pursuit of higher returns.
The operative question is not, "What is a good ratio?" but rather, "What is the right ratio for our institution, at this time, and how does it compare to our true peers?" Data intelligence provides the clarity to answer this question with confidence.
How Do Regulators View This Ratio?
Regulators monitor the LTD ratio closely as a key indicator of an institution's liquidity risk profile. While no explicit regulatory cap exists, a ratio that consistently trends above 95% or exceeds 100% will invariably attract heightened supervisory attention.
A ratio at this level signals a reliance on non-core, wholesale funding sources like FHLB advances or brokered deposits, rather than stable core deposits. Regulators will expect the institution to have a well-documented and robust strategy for managing this elevated risk. An inability to justify a high ratio is a significant red flag.
What Is the Impact of Brokered Deposits?
Including brokered deposits in the calculation of total deposits will mechanically lower the LTD ratio. While this may improve the surface-level appearance of the metric, it can create a false sense of security regarding the bank's true liquidity position. Brokered deposits, often termed "hot money," are highly rate-sensitive and can exit the institution rapidly, creating sudden funding gaps.
For an accurate assessment of the bank's position, executives should monitor two distinct metrics:
- The Standard LTD Ratio: Including all deposit types.
- A Core LTD Ratio: Excluding brokered deposits and other wholesale funding.
Tracking both ratios provides a more complete and honest picture of the bank's reliance on stable, low-cost core funding versus more volatile sources. This dual analysis is not just a matter of accounting; it is fundamental to sound risk management and strategic decision-making.
At Visbanking, we provide clarity, not just data. It's time to move beyond static reports and make decisions with confidence. Benchmark against your true peers, monitor your LTD ratio in near-real-time, and arm your leadership team with the actionable intelligence required to win. Find out how at https://www.visbanking.com.
Latest Articles

Brian's Banking Blog
What Is Historical Analysis? a Banker's Working Definition

Brian's Banking Blog
Customer Churn Prediction: A Practical Guide for Banks

Brian's Banking Blog
Social Network Analysis for Banking: A Practical Guide

Brian's Banking Blog
How to Increase ROE: A Data-Driven Playbook for Bank Leaders

Brian's Banking Blog
What Is SEC EDGAR and How Banks Use the Data

Brian's Banking Blog