Understanding the Loan Deposit Ratio: Key Facts & Tips
Brian's Banking Blog
At its core, the loan deposit ratio (LDR) is one of the most straightforward yet powerful metrics in banking. It tells you exactly how much of a bank's deposit base is being funneled into loans. Simple, right?
But this single number reveals a ton about a bank's operational strategy, its risk appetite, and its overall health. It’s all about balancing the drive for profitability (earned from lending) against the absolute necessity of having enough cash on hand for customer withdrawals. A higher ratio often signals higher profits, but it also dials up the risk.
Decoding the Loan Deposit Ratio

Think of your bank like a town’s financial reservoir. The deposits coming in from customers and local businesses are the water filling it up. The loans going out—for mortgages, business expansions, or car financing—are the water being channeled out to help the community grow.
The loan deposit ratio simply measures the balance between the water coming in and the water going out.
It answers one critical question: For every dollar the bank is holding in deposits, how many cents is it lending back out into the economy? This percentage gives you a clear snapshot of a bank's strategy and its role in the financial ecosystem.
Before we go deeper, here's a quick cheat sheet to get the basics down.
Loan Deposit Ratio At A Glance
| Component | Description | Importance |
|---|---|---|
| Total Loans | The total value of all loans a bank has issued to its customers. | This is the primary engine for a bank's revenue generation through interest income. |
| Total Deposits | The total value of all customer funds held by the bank (checking, savings, CDs, etc.). | This represents the bank's core funding source and a liability owed to depositors. |
| The Ratio (LDR) | The percentage calculated by dividing total loans by total deposits. | It's a key indicator of liquidity risk and operational strategy. |
This table lays out the moving parts, but the real story is in how they interact.
Why This Ratio Is a Vital Sign
The LDR isn't just some number for an internal spreadsheet; it's a vital sign that a lot of different people are watching very closely.
- For Regulators: It's a primary gauge of a bank's liquidity risk. If the ratio climbs too high, it sends up a red flag about the bank's ability to cover a sudden wave of withdrawals.
- For Investors: It offers a glimpse into the bank's earning power. A consistently low ratio might suggest the bank is leaving money on the table by not lending enough.
- For Depositors: While you might not check it daily, it’s a reflection of the bank’s stability. It shows whether the institution you trust with your money is being managed prudently.
Recent history really drives this point home. Between April 2022 and April 2023, the entire U.S. banking system saw deposits drop by a staggering $960 billion. This massive outflow of deposits was a key reason the national loan deposit ratio jumped from 61% to 70% in just one year, though it stayed just below the 10-year average of 72%. For more on this, you can check out the full Federal Reserve report on banking conditions.
The Two Sides of the LDR Coin
Ultimately, the loan deposit ratio comes down to a fundamental trade-off.
A high LDR suggests a bank is being aggressive, putting its assets to work to generate as much loan income as possible. That’s great for profitability. But it also means there's less cash in the vault, making the bank more vulnerable if the economy sours or depositors get nervous.
On the flip side, a low LDR points to a more conservative, safety-first approach. The bank is swimming in liquidity, but it might be underusing its deposit base, which can hurt profits and shareholder returns.
Getting a handle on this delicate balancing act is the first real step to evaluating where a bank stands and where it's headed.
Calculating the Loan Deposit Ratio Step by Step

While the loan-to-deposit ratio is a powerful metric, the good news is you don’t need an advanced degree in mathematics to figure it out. It's refreshingly simple.
There’s no complex algebra or mysterious variables to wrestle with. The whole thing boils down to one straightforward formula.
The LDR Formula: Loan-to-Deposit Ratio = (Total Loans ÷ Total Deposits) x 100
This gives you a clean percentage that’s easy to understand and even easier to compare. To really get a feel for how it works, let's unpack each piece and then run through a quick, real-world scenario.
Defining the Components
Before you start plugging in numbers, you need to know exactly what you’re working with. These figures come straight from a bank's balance sheet, one of its core financial statements.
- Total Loans: This is exactly what it sounds like—the sum of all money the bank has loaned out. It covers everything from mortgages and car loans to commercial lines of credit. This number represents the bank's main engine for generating revenue.
- Total Deposits: This is all the money customers have entrusted to the bank. Think checking and savings accounts, money markets, and certificates of deposit (CDs). This is the primary fuel for the bank's lending engine.
Getting a firm grip on what these two numbers reveal about lending activity is the key to truly understanding what the LDR is telling you.
A Practical Example
Let’s put this formula to the test with a hypothetical community bank we’ll call "Main Street Bank." A quick look at their latest quarterly statement gives us the numbers we need:
- Total Loans: $85,000,000
- Total Deposits: $100,000,000
Now, we just pop these values into our formula:
LDR = ($85,000,000 ÷ $100,000,000) x 100
LDR = 0.85 x 100
LDR = 85%
What does this tell us? It means that for every single dollar Main Street Bank holds in deposits, it has loaned out 85 cents. Just like that, two massive numbers from a financial report are transformed into a single, meaningful percentage that tells a clear story about the bank's strategy and liquidity position.
Finding the Sweet Spot for a Healthy LDR
The loan deposit ratio tells a rich story about a bank's strategy and its appetite for risk. It’s not just some dry percentage on a spreadsheet; it’s a living reflection of the constant balancing act between being aggressive and being cautious. Nailing this balance is absolutely critical for long-term stability and profitability.
A really high ratio, for instance, screams aggressive lending. While that can certainly juice profits in the short term, it also cranks up the liquidity risk. If a wave of depositors suddenly wants their money back, a bank with a high LDR might have to scramble, potentially selling assets at a loss just to meet those demands.
On the flip side, a very low ratio suggests the bank is playing it almost too safe. Sure, it’s got plenty of cash on hand, but it's probably missing out on solid, profitable lending opportunities. This can lead to lower returns for shareholders and might even signal that the bank isn't fully serving the credit needs of its community.
This simple infographic below shows you exactly how the two core pieces feed directly into the loan deposit ratio.
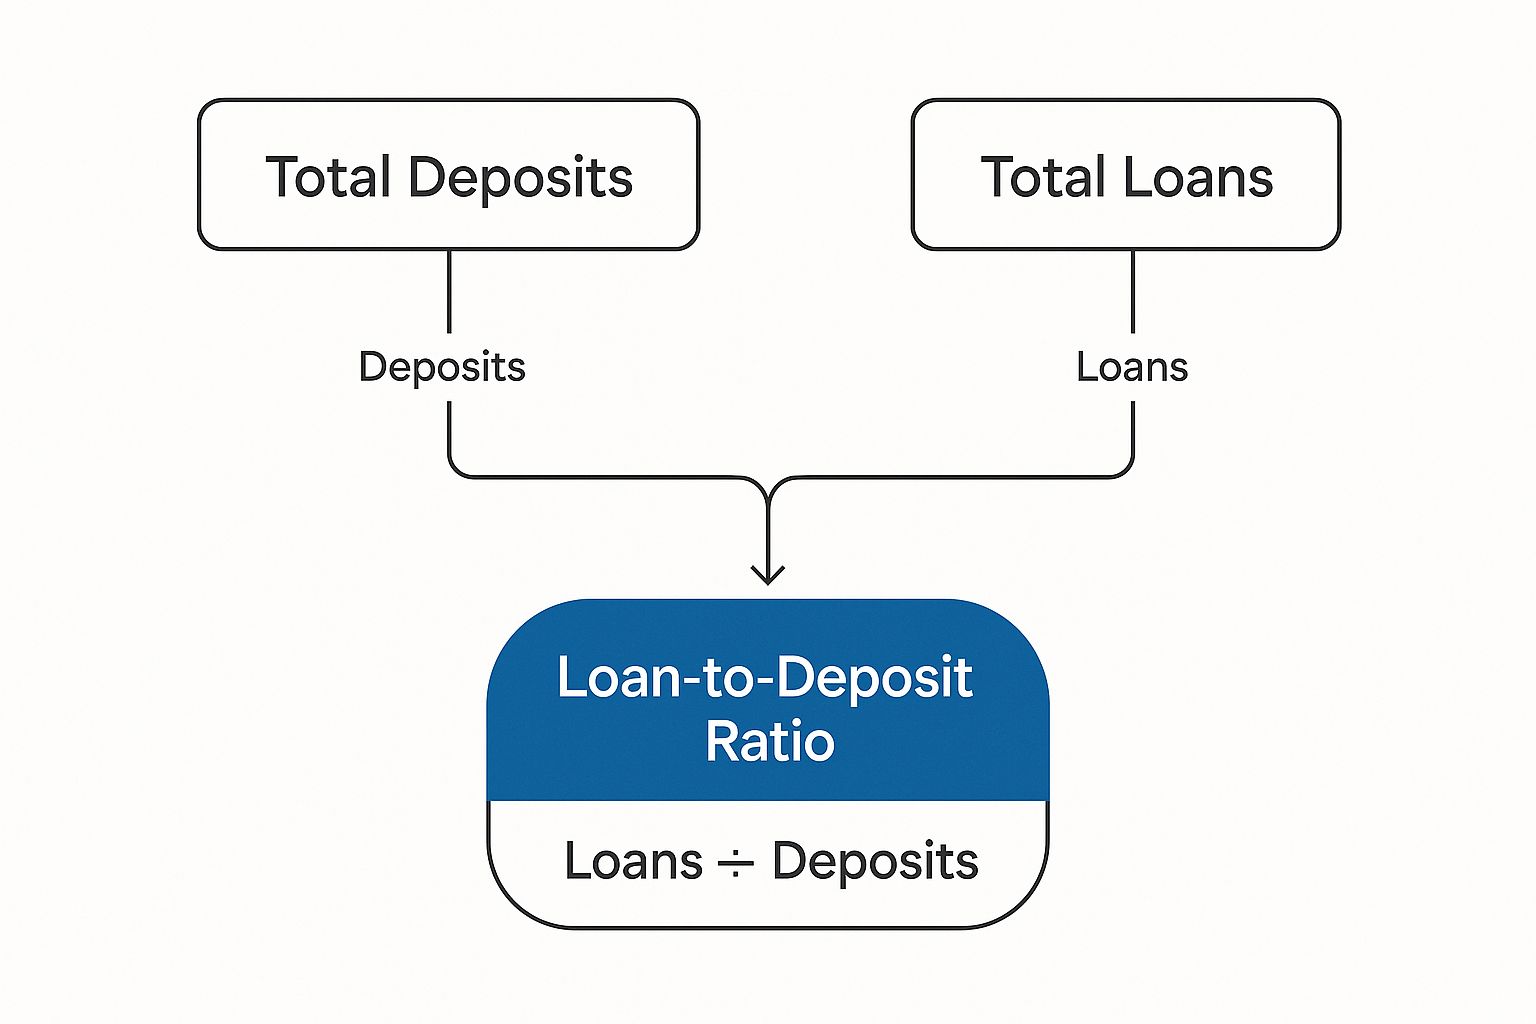
The visual makes it crystal clear: the ratio is a direct result of how a bank manages its loans against its deposits. Getting your head around this relationship is the first step to really understanding what a specific LDR figure is telling you.
The Goldilocks Zone
So, what's the magic number? Most industry experts and regulators point to a loan deposit ratio between 80% and 90% as the optimal range—the "Goldilocks zone."
A ratio in this sweet spot generally means a bank is putting its deposits to work earning income through loans, but not so aggressively that it's putting its liquidity on the line. It’s the hallmark of a healthy, well-managed institution.
A bank humming along in this range has found a sustainable rhythm. It's earning solid returns on its assets while keeping enough of a cushion to handle whatever the economy or its depositors might throw at it.
What Different LDRs Tell You
Stepping outside this ideal range isn’t an automatic red flag, but it gives you some powerful clues about a bank's game plan. Here’s a quick guide to reading the signs:
- Aggressive Stance (Above 90%): A bank consistently pushing past 90% is all-in on lending. It might be tapping into other, more volatile funding sources beyond core deposits to fuel that loan growth. This can be a high-reward strategy, but it definitely comes with higher risk.
- Conservative Stance (Below 80%): An LDR below this line points to a much more cautious approach. The bank is prioritizing safety and liquidity, maybe because of economic uncertainty or a business model that requires more cash on hand. The trade-off? It might be leaving money on the table and underperforming its peers.
At the end of the day, the perfect loan deposit ratio is a moving target. It really depends on a bank's specific goals, its customer base, and the wider economic climate. But knowing where that Goldilocks zone is gives you a powerful benchmark for judging any financial institution's true footing.
How Economic Cycles Shape LDR Benchmarks
A bank's loan-to-deposit ratio doesn't live in a bubble. Far from it. It's a living, breathing metric that inhales and exhales with the health of the broader economy.
Thinking about it this way helps: when the economy is booming, everyone feels optimistic. Businesses are ready to expand and people are confidently buying homes and cars. That surge in credit demand naturally swells a bank's loan portfolio, often faster than its deposits are coming in. As a result, the LDR for the whole industry starts to climb.
But when a recession looms, the script flips entirely. Businesses slam the brakes on spending and consumers clutch their wallets. Loan demand evaporates. At the same time, banks—now wary of defaults—tighten up their lending standards. This one-two punch slows loan growth to a crawl, pushing the industry's average LDR back down.
The Ebb and Flow of Historical LDR
This isn't just a theory; you can see it plain as day in the historical data. The LDR isn't some new-fangled metric. It's been tracked in the U.S. for well over a century, giving us a fascinating window into banking trends across all sorts of economic weather.
Data from national banks goes back as far as March 1875. In our modern era, the typical LDR for U.S. banks has settled around the 70% mark, which serves as a decent baseline. If you're a data nerd, you can dive into a treasure trove of historical LDR data on the FRED database and see these long-term currents for yourself.
This chart from the Federal Reserve paints a crystal-clear picture of these cycles over the last few decades.

You can't miss the peaks and valleys. The ratio clearly marches upward during periods of economic expansion and then takes a nosedive after major financial shocks, like the 2008 crisis.
Reading the LDR in Context
This history lesson proves one thing: a static benchmark is practically useless. A loan-to-deposit ratio of 95% might be perfectly fine during a strong growth phase, but it could be a massive red flag on the eve of a downturn. Context is king.
Here’s a practical way to frame it:
- During an Economic Expansion: You expect to see higher LDRs. Banks are doing their job, fueling growth. A bank with a surprisingly low LDR might be leaving money on the table.
- During an Economic Contraction: Caution becomes the mantra. LDRs naturally dip as banks focus on shoring up liquidity and managing risk. A bank still holding a sky-high LDR in a recession might be taking on way too much risk.
The bottom line is that you have to evaluate LDR with a dual lens. You look at the number itself, but just as importantly, you look at the economic world it's living in. A "good" ratio is simply one that's appropriate for the moment—balancing the drive for profit with a healthy dose of prudence.
The Risks of an Unbalanced LDR
When a bank’s loan-to-deposit ratio gets out of whack, it’s not just a number on a spreadsheet—it signals real-world trouble. Think of it like a tightrope walk. Leaning too far in either direction can lead to a nasty fall, and each direction comes with its own unique set of risks for the bank, its customers, and its shareholders.
A dangerously high LDR is the financial equivalent of driving your car with the gas light blinking. Sure, the bank is squeezing every last drop of income from its loans, but it's left with almost no cushion for unexpected cash needs. This is a classic recipe for liquidity risk.
A liquidity crisis is what happens when a bank simply can’t meet its immediate cash obligations. If a wave of depositors decides to pull their money out all at once, an institution with a sky-high LDR might be forced to sell assets at fire-sale prices, triggering massive losses or even complete failure.
This isn’t just a theoretical scare tactic; it’s a primary reason regulators watch this metric like a hawk.
The Problem of a Low LDR
On the flip side, a stubbornly low loan-to-deposit ratio points to a different kind of problem: opportunity cost. A bank is in the business of lending. When it’s not putting its deposits to work, it’s like a factory running at half-capacity. This kind of underperformance hurts in a few key ways:
- Weak Shareholder Returns: Fewer loans mean less interest income. It's a simple equation that leads directly to lower profitability and unhappy investors.
- Lost Competitive Ground: While you're sitting on cash, your competitors are out there growing their loan books, grabbing market share, and strengthening customer relationships.
- Community Underservice: Banks are the lifeblood of local economies. A low LDR can mean that good, qualified people and businesses in the community aren't getting the credit they need to grow and prosper.
Recent trends paint a clear picture of how these dynamics play out. As of Q3 2022, the U.S. banking industry’s aggregate LDR climbed to 62.0% as loan growth outpaced slowing deposit balances, signaling tighter liquidity across the board.
To get a feel for the bigger picture, it's worth exploring how these banking trends affect lending conditions on a global scale.
To help visualize these opposing forces, let's break down the risks associated with different LDR levels.
LDR Scenarios and Associated Risks
| LDR Scenario | Primary Risk | Potential Consequence | Strategic Implication |
|---|---|---|---|
| High LDR (>90%) | Liquidity Risk | Inability to meet depositor withdrawals, forced asset sales at a loss, potential bank run. | Must secure alternative funding sources; may need to slow loan growth. |
| Optimal LDR (80-90%) | Balanced Risk | Generally stable, but requires constant monitoring of economic conditions and depositor behavior. | Focus on maintaining a high-quality loan portfolio and a diverse deposit base. |
| Low LDR (<80%) | Opportunity Cost | Lower profitability, reduced shareholder returns, loss of market share to competitors. | Need to stimulate loan demand, potentially by exploring new markets or products. |
Each scenario demands a different strategic response. The key is not just to find a "good" number but to actively manage the ratio based on the bank's specific strategy and market environment.
To navigate these competing pressures, every institution needs a solid banking risk management framework that tackles both liquidity risk and opportunity cost head-on. Managing the quality of the loans themselves is a huge piece of this puzzle. Robust due diligence, often streamlined using secure data rooms for due diligence, is non-negotiable for building a healthy loan portfolio that can support a balanced and profitable LDR.
Proven Strategies to Get Your LDR Just Right
Let’s be honest: managing your loan-to-deposit ratio isn’t a set-it-and-forget-it task. You can’t just let it float along with the market tide. It's a hands-on job that requires a smart, two-pronged attack on both sides of your balance sheet. You have to actively steer the ship, strategically growing your deposit base while keeping a firm hand on your loan portfolio.
This means getting out of the world of theory and into the trenches. On the deposit side, think about launching targeted marketing campaigns to bring in those sticky, low-cost core deposits. Maybe it's time to offer more competitive rates on checking and savings accounts or cook up specialized products that really speak to specific customer groups. The goal is to build a rock-solid deposit foundation.
Sharpening Your Loan Portfolio Management
At the same time, you need disciplined management over on the loan side. This is about more than just churning out new loans; it’s about architecting the entire portfolio for both resilience and profit.
A few key moves here include:
- Diversifying Loan Types: Don't put all your lending eggs in one basket. Spreading your loans across different sectors (like commercial, real estate, and consumer) and geographic areas can insulate your bank if one specific area hits a rough patch.
- Selling Loans: The secondary market is your friend. Actively selling off certain loans, like conforming mortgages, is a great way to free up capital and boost liquidity. You can then put that money to work in new lending opportunities without sending your LDR through the roof.
- Adjusting Underwriting Standards: This is one of the most fundamental levers you can pull. Tightening or loosening your lending criteria based on what the economy is telling you is crucial for managing both loan growth and credit risk.
The real aim here is to build a high-quality, diversified loan book that kicks off consistent returns while staying in sync with your bank's risk appetite. This kind of active management is a cornerstone of smart financial institution risk management.
Using Financial Intelligence to Your Advantage
In today's market, making decisions based on "gut-feel" alone is a recipe for trouble. Modern financial intelligence platforms—like Visbanking’s Bank Intelligence and Action System (BIAS)—are no longer a nice-to-have; they’re essential for seeing what’s happening in real-time and making decisions backed by data. These tools are masters at turning mountains of raw data into crystal-clear, actionable insights.
This dashboard gives you an instant, visual read on how your bank's key metrics stack up against your peers, including the critical ratios that feed into your LDR. When you have this kind of intelligence right at your fingertips, you can spot trends before they become problems, benchmark your strategies, and make the small adjustments needed to maintain that perfect balance between profitability and stability.
Of course, these powerful tools need good fuel. Implementing efficient data management through platforms like Cloud Accounting Solutions ensures you’re feeding them the accurate, timely financial insights they need to work their magic.
Answering Your Lingering LDR Questions
Alright, we've covered the what and the why. But even with a solid handle on the loan-to-deposit ratio, a few practical questions always seem to pop up. The world of finance isn't static, and context is king. Let's tackle some of the most common queries to sharpen your understanding.
What’s a "Good" Loan-to-Deposit Ratio, Really?
If you're looking for a magic number, you won't find one. But if you’re looking for a healthy range, the industry generally considers 80% to 90% the sweet spot. It’s the sign of a bank that’s putting its deposits to work generating income, but without stretching itself too thin on liquidity. Think of it as a healthy balance.
That said, the ideal LDR is a moving target. It shifts depending on a bank’s size, its specific business model, and the broader economic winds. Regulators definitely keep a close eye on this metric, but they don't hand down a single, one-size-fits-all mandate.
How Do Central Bank Policies Mess with the LDR?
Central bank moves, particularly interest rate changes, have a massive and immediate ripple effect on the LDR. It’s a pretty direct relationship.
When the central bank hikes rates, borrowing gets more expensive. Unsurprisingly, this tends to cool off demand for new loans. At the same time, those higher rates make savings accounts look a lot more attractive, pulling in more deposits. That one-two punch often drives the LDR down.
The reverse is also true. When the central bank slashes rates to fire up the economy, borrowing becomes cheap and saving becomes less appealing. This can send the LDR climbing. Your bank's LDR is fundamentally tethered to the monetary policy of the day.
Can a Bank’s LDR Actually Go Over 100%?
You bet. An LDR north of 100% means a bank has loaned out more cash than it holds in customer deposits. It’s not magic; it just means the bank has to find its funding somewhere else.
They do this by tapping into non-deposit sources like:
- Interbank Loans: Just borrowing from other banks.
- Issuing Bonds: Selling debt to investors to raise capital.
- Wholesale Funding: Dipping into money markets for short-term cash.
An LDR over 100% is a tell-tale sign of an aggressive growth strategy. But it's also a big red flag. It signals a heavy reliance on funding sources that are often more volatile and expensive, which dials up the bank's risk profile significantly.
Ready to stop guessing where your bank stands? Visbanking’s Bank Intelligence and Action System (BIAS) turns a mountain of peer data into clear, actionable insights for your loan-to-deposit ratio and a whole lot more. See how you stack up with Visbanking today.
Latest Articles

Brian's Banking Blog
What Is Historical Analysis? a Banker's Working Definition

Brian's Banking Blog
Customer Churn Prediction: A Practical Guide for Banks

Brian's Banking Blog
Social Network Analysis for Banking: A Practical Guide

Brian's Banking Blog
How to Increase ROE: A Data-Driven Playbook for Bank Leaders

Brian's Banking Blog
What Is SEC EDGAR and How Banks Use the Data

Brian's Banking Blog