How to Calculate Return on Assets: A Guide for Bank Executives
Brian's Banking Blog
Return on Assets (ROA) is a foundational metric in banking, calculated by dividing a bank's Net Income by its Average Total Assets.
While the formula is simple, its implications are profound. ROA is the definitive measure of management’s ability to convert the bank’s asset base—primarily loans and securities—into profit. For bank executives and directors, it serves as the ultimate scorecard for operational efficiency.
Why ROA is a Critical Metric for Bank Leadership
For any bank executive, ROA is more than a line item in a report; it is a direct reflection of your institution's core profitability and strategic discipline.
While other metrics can be influenced by financial leverage, ROA provides an unvarnished view of how effectively your institution generates earnings from its balance sheet. A strong ROA is the result of deliberate strategy—it signals a disciplined approach to asset deployment and rigorous control over operational expenses. Every significant decision, from approving a new lending program to investing in branch infrastructure, ultimately impacts this critical figure.
The Strategic Value of the ROA Calculation
Calculating ROA is step one. The real value for leadership lies in using it as a diagnostic tool to assess performance. A consistently high ROA indicates that management is executing on fundamentals:
- Effective Lending: The loan portfolio is not just growing; it is generating strong, risk-adjusted returns.
- Optimized Asset Mix: The balance between loans and securities is calibrated to maximize returns while managing risk.
- Operational Efficiency: Non-interest expenses are tightly controlled, protecting the bottom line.
Conversely, a declining ROA is an early warning system. It can signal deteriorating asset quality, margin compression, or bloated overhead—issues that require immediate board-level attention.
As a point of reference, top-performing U.S. firms across major exchanges often achieve ROA figures near 6-7% during favorable economic periods. For a deeper analysis of historical market returns, the National Bureau of Economic Research provides extensive data.
The following table breaks down the components of the ROA calculation from a strategic perspective.
ROA Calculation Key Components
| Component | Definition for a Bank | Where to Find It (Source) | Strategic Importance |
|---|---|---|---|
| Net Income | The bank's profit after all expenses, taxes, and loan loss provisions are accounted for. | The bottom line of the Income Statement (from the Call Report). | Measures overall profitability and the end result of all operational and lending activities. |
| Average Total Assets | The average value of all assets (loans, securities, cash, etc.) over a specific period. | Calculated from the Balance Sheet (from the Call Report). Typically: (Start of Period Assets + End of Period Assets) / 2. | Smooths out balance sheet fluctuations to provide a stable, accurate base for measuring income generation. |
Each component tells a critical part of your bank's performance story.
For a bank’s leadership team, ROA answers the most fundamental question: How much profit are we generating for every dollar of assets under our control? This clarity is indispensable for setting strategy and holding management accountable for performance.
When this calculation is embedded into regular performance reviews, it grounds strategic discussions in objective data. With a data intelligence platform like Visbanking, you can automate this analysis. You can instantly calculate your ROA and, more importantly, benchmark it against precisely defined peer groups—transforming a simple metric into a tool for building a sustainable competitive advantage.
A Practical Walkthrough of the ROA Calculation
Calculating your bank’s Return on Assets is straightforward, but precision is essential. The formula is Net Income divided by Average Total Assets. For executives, the critical task is ensuring the integrity of the inputs, which are sourced directly from the bank's financial statements, typically the Call Report.
Net Income is the bottom line of the income statement, representing profit after all expenses, provisions, and taxes. Total Assets is taken from the balance sheet.
Why Average Total Assets is Non-Negotiable
A common error is to use the end-of-period asset figure. This is a mistake that can distort reality.
A bank’s balance sheet is dynamic. Significant deposits, loan fundings, or securities purchases near quarter-end can skew the total asset figure, leading to a misleading ROA.
Using Average Total Assets provides a more stable and accurate denominator. The calculation—(Beginning Assets + Ending Assets) / 2—smooths out short-term volatility and better reflects the asset base that actually generated the period's income.
To explore how ROA compares with other key performance indicators, see our guide on understanding Return on Assets and Return on Equity in banking.
Let's apply this with a practical example.
Example Calculation for a Community Bank
Consider the annual performance of a hypothetical institution, "First Fidelity Bank."
- Net Income (Year-End): $5.2 million
- Total Assets (Start of Year): $580 million
- Total Assets (End of Year): $620 million
First, calculate Average Total Assets:
( $580,000,000 + $620,000,000 ) / 2 = $600,000,000
Now, apply the ROA formula:
$5,200,000 / $600,000,000 = 0.00867
Expressed as a percentage, First Fidelity Bank’s ROA for the year is 0.87%. This figure is now ready for strategic analysis and peer benchmarking.
This is not an academic exercise; it is a vital sign of your bank's health and efficiency. While broad market indices like the S&P 500 may average returns near 10%, those figures are highly volatile. A bank's ROA is a more fundamental measure of the operational engine that drives sustainable value. Consistent and accurate calculation is essential for strategic planning.
The infographic below illustrates how raw financial data translates into the final ROA percentage.
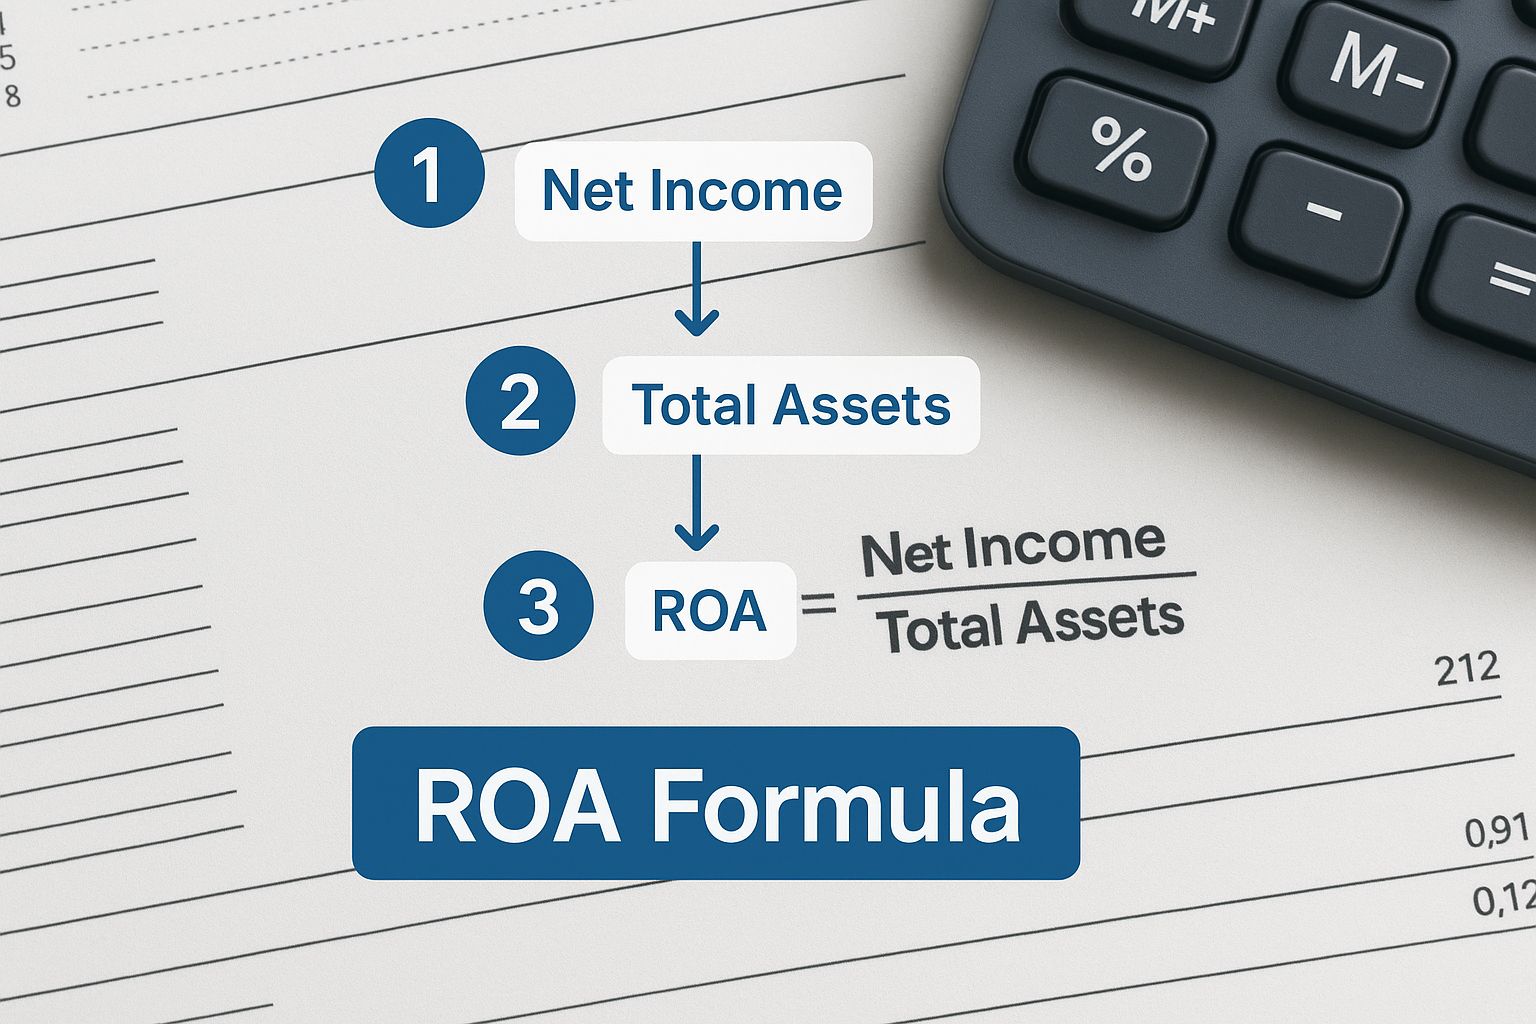
This process creates a direct line from your financials to an actionable metric. Once the calculation is mastered, the real executive work—interpretation and comparison—begins. This is where data intelligence platforms like Visbanking’s BIAS add immense value, automating the calculations so you can focus on benchmarking your performance against a curated peer group.
Interpreting Your Bank's ROA
Calculating your bank's ROA is the starting point. An isolated figure—whether 0.75% or 1.1%—is meaningless without context. For bank executives, this is where raw data is transformed into strategic intelligence.
Your ROA is a powerful diagnostic tool. It tells a story about your institution's operational health, risk appetite, and overall efficiency. A change in this metric is a clear signal that the underlying drivers of profitability are shifting. Your task is to understand why.
Reading the Signals in Your ROA Trend
The trajectory of your ROA over time reveals a narrative. Is it one of efficient growth, or are operational drags emerging?
- A Rising ROA typically signals positive momentum. It could indicate that your lending team is booking higher-quality, more profitable loans. Perhaps non-interest income is growing, or the institution has successfully contained expenses. It reflects disciplined balance sheet management.
- A Falling ROA is an immediate call to action. The cause could be anything from compressing net interest margins to a spike in loan loss provisions or escalating overhead. Each potential cause requires a distinct strategic response.
Consider two community banks, both with $500 million in assets. Bank A achieves an ROA of 1.1%, generating $5.5 million in net income. Bank B reports an ROA of 0.75%, resulting in $3.75 million in net income. That $1.75 million difference is a direct outcome of their respective strategies in lending, fee generation, and cost control.
A high ROA demands scrutiny. While it often indicates superior efficiency, it could also signal that the bank is taking on excessive risk to chase higher yields. A thorough analysis is always required.
Historical and Market Context for ROA
The focus on asset efficiency is a long-established principle of market analysis. Historically, the U.S. market has demonstrated exceptionally high returns on capital. One study revealed that from 1921 to 1995, the average real rate of return on equity in the U.S. was 4.73%, significantly outpacing a global median of 1.5%. This history has set a high bar for asset utilization in the U.S. financial system—a standard that continues to shape expectations.
You can explore more on these historical asset returns to understand the long-term trends. This context underscores why a rigorous analysis of your bank’s financial performance is critical for strategic planning.
To truly understand the drivers of your ROA, you must dissect its components by analyzing your income statement and balance sheet. For executives seeking to deepen this capability, our guide on how to analyze financial statements provides a comprehensive framework.
With clear insight into the underlying data, you can directly link your ROA to strategic initiatives. A platform like Visbanking's BIAS excels here, automating this entire process and enabling you to benchmark not just the final ROA but also the key component ratios. This is how a simple metric becomes a powerful tool for proactive, data-driven leadership.
Benchmarking ROA Against Peers and Market Trends
An ROA figure is inert until it is contextualized through rigorous benchmarking. A 1.0% ROA may seem adequate, but if your direct competitors are consistently achieving 1.25%, that "adequate" performance is actually a competitive disadvantage.
The true value emerges when you compare your ROA against carefully selected peer groups, transforming a single data point into a measure of relative market performance.
The Importance of a Precise Peer Group
Generic, nationwide averages are often misleading and should be avoided. A community bank in a rural market operates under vastly different conditions than a multi-billion-dollar institution in a major metropolitan area. Effective benchmarking requires precision.
A comprehensive analysis should incorporate several peer sets:
- Local Competitors: The institutions you compete against directly for customers and loans.
- Statewide Peers: Banks of a similar asset size within your state, operating in the same economic and regulatory climate.
- Aspirational Peers: Top-quartile performers of a similar size and business model on a national level. This group represents what best-in-class performance looks like.
Comparing your bank against these distinct groups isolates whether performance gaps are due to local market conditions or internal strategic and operational factors. This is the essence of what financial benchmarking is and why it matters.
A Practical Benchmarking Scenario
Imagine your institution, "First National Bank," reports an ROA of 0.95%. In isolation, the board might view this as a success. However, peer analysis reveals a different story.
ROA Benchmarking Analysis Example
| Metric | Your Bank | Local Competitor Average | Statewide Peer Average (Same Asset Size) | Top Quartile Performers (National) |
|---|---|---|---|---|
| ROA | 0.95% | 0.98% | 1.05% | 1.30% |
| Net Interest Margin | 3.40% | 3.45% | 3.60% | 3.85% |
| Efficiency Ratio | 65% | 64% | 60% | 54% |
This comparison immediately highlights the strategic challenges. First National is slightly behind local rivals but significantly trails top-quartile performers. The data clearly points to a compressed Net Interest Margin and an elevated Efficiency Ratio as the primary drivers of this underperformance. The bank is not just less profitable; it is less efficient.
This is where modern data intelligence empowers leadership. The conversation shifts from opinion-based debates to data-driven action. The executive team can now focus on specific, quantified challenges, such as optimizing loan pricing or reducing operational overhead.

Manually compiling this data from Call Reports is an inefficient and error-prone process.
Bank intelligence platforms like Visbanking’s BIAS automate this entirely. With a few clicks, executives can generate these comparisons, drill down into the underlying drivers, and focus their time on strategy, not spreadsheet management. This is how the ROA calculation becomes a catalyst for informed decision-making.
Using Data Intelligence to Actively Improve ROA
Knowing your ROA is foundational. Improving it is the objective. For bank executives and directors, a declining ROA should be seen not as a failure but as a clear directive on where to focus strategic attention.
Fundamentally, there are only two levers to improve ROA: increasing Net Income or optimizing the Asset Base. Modern data intelligence platforms remove the guesswork, allowing leadership to move from hypothesis to data-backed action.
Driving Net Income Higher
Boosting profitability requires a granular analysis of revenue streams and cost structures.
- Loan Yield Analysis: Are specific loan categories underperforming relative to your peers? A robust data platform enables you to analyze your portfolio by type, region, and officer to identify lagging yields. This insight directly informs pricing strategy and business development focus.
- Fee Income Opportunities: How does your non-interest income compare to top-performing banks? Peer analysis can reveal significant untapped revenue streams, whether in treasury management services, deposit account fees, or wealth management. Data provides the evidence needed to justify strategic shifts.
Optimizing the Asset Base
The second lever is ensuring every dollar on your balance sheet is deployed effectively. This is a matter of continuous discipline.
The Visbanking BIAS platform visualizes these critical asset allocation trends instantly.
This type of dashboard view allows executives to assess their asset mix at a glance and benchmark it against any custom peer group, turning raw data into a strategic roadmap.
The strategic imperative is clear: stop managing your bank through the rearview mirror. Real-time data intelligence allows you to move from reacting to historical performance to proactively shaping future results.
This enables active management of the balance sheet. Shifting even a small portion of assets from lower-yielding securities into high-quality loans can have a material impact on ROA. Furthermore, the aggressive management of non-performing assets is critical; these assets are a direct drag on profitability, consuming capital that should be generating returns.
While emerging AI-powered tools like Microsoft Copilot for Finance can accelerate financial analysis, they do not replace the need for a dedicated bank intelligence platform that provides the foundational data and peer context.
Ultimately, knowing how to calculate return on assets is table stakes. The competitive advantage is derived from using that metric to drive decisive, data-informed action.
To see how your bank’s ROA and its underlying components compare to the competition, explore the benchmarking capabilities within Visbanking’s BIAS platform.
From the Corner Office: Your ROA Questions Answered
Bank leaders consistently raise the same core questions about Return on Assets. They need to understand what the numbers mean for strategy and execution. Here are direct answers to the most common inquiries.
What is a “Good” ROA for a Community Bank?
While 1.0% is often cited as a benchmark, a "good" ROA is entirely dependent on context.
An ROA of 0.85% during a recession could represent outstanding performance. Conversely, a 1.1% ROA in a booming economy might simply be average.
The most effective approach is to abandon generic benchmarks. True performance is measured against a curated peer group of banks with a similar asset size, geographic footprint, and business model. This creates a meaningful target that reflects your specific operating environment.
How Should the Board Interpret ROA vs. ROE?
ROA and Return on Equity (ROE) are complementary metrics, each providing a different but critical perspective on performance.
- Return on Assets (ROA) is the purest measure of operational efficiency. It answers the question: How effectively is management using the bank's total assets to generate profit? It provides an unadulterated view of core performance.
- Return on Equity (ROE) measures the return generated for shareholders. However, ROE is sensitive to financial leverage. A bank can increase its ROE by taking on more debt, which may mask underlying operational weaknesses.
For the board and executive team, ROA is the primary report card on management’s ability to operate the bank efficiently. ROE is the key metric for shareholders and is central to capital planning discussions.
Our ROA is Declining. Where Should We Investigate First?
A falling ROA is a critical warning sign that requires immediate investigation. Focus your initial analysis on three key areas:
- Deconstruct Net Income: Is the Net Interest Margin (NIM) compressing? Was there a significant increase in the provision for loan losses? Are non-interest expenses rising faster than revenue? The income statement will reveal the primary source of the pressure.
- Assess Asset Quality: A rise in non-performing assets (NPAs) is a direct drain on profitability. NPAs tie up capital without generating income and are a significant drag on ROA.
- Review the Asset Mix: Has the composition of your balance sheet shifted toward lower-yielding assets? An accumulation of excess liquidity or an over-allocation to low-risk securities can gradually erode your bank's earning potential.
Diagnosing these drivers manually is a time-intensive and inefficient process. With Visbanking, this analysis is automated, transforming weeks of work into minutes. Our BIAS platform enables you to instantly dissect performance trends and benchmark every component of your ROA against your true peers.
Turn your data into decisive action. Explore the possibilities at https://www.visbanking.com.
Latest Articles

Brian's Banking Blog
Fraud Detection in Banking Guide for Executives

Brian's Banking Blog
How to Identify Growth Opportunities in Banking Sales

Brian's Banking Blog
Bank Email Signature Examples: Executive Templates 2026

Brian's Banking Blog
International Management Internships: A Bank's Playbook

Brian's Banking Blog
Form 5500 Data: Unlock Bank Growth in 2026

Brian's Banking Blog