How to Build Financial Models for Modern Banking
Brian's Banking Blog
For bank executives, a financial model is not merely a back-office calculation; it is the quantitative expression of strategy. A well-constructed model provides the clarity required to navigate a volatile market, stress-test capital, evaluate M&A opportunities, and allocate resources with precision. It is the tool that anchors strategic "what-if" scenarios in financial reality, enabling decisive leadership.
The Blueprint for a Strategic Financial Model
A strategic financial model is the blueprint for a bank's vision, quantifying the drivers that underpin its business model innovation. Its purpose is not simply to produce a forecast but to build a dynamic engine for decision-making. The first step is not data entry; it is defining the critical business questions the model must answer.
The demand for this level of sophistication is accelerating. The global market for corporate financial modeling is projected to expand from USD 1.59 billion in 2024 to USD 2.49 billion by 2032, a direct result of increasing financial complexity and the mandate for data-driven decisions.
Shifting from Calculation to Strategic Insight
An effective model is dynamic, transparent, and directly linked to the key performance drivers of the institution. It is the difference between a static report and an interactive tool that informs real-time executive action.
The pillars of a model that delivers genuine strategic value are:
- Clarity of Purpose: Define the primary objective. Is the model for the annual budget, a potential acquisition, or regulatory stress testing? Each use case demands a different level of detail. An M&A model must focus on synergy valuation and accretion/dilution, while a capital planning model requires granular projections of risk-weighted assets.
- Driver-Based Assumptions: Static historical growth rates are insufficient. A robust model is built around key operational drivers: loan origination volume, deposit mix, and sources of non-interest income. For example, instead of a simple 5% loan growth assumption, the model should be driven by a projected $150M increase in C&I originations and a $50M runoff in residential mortgages, allowing leadership to test specific strategic initiatives.
- Integrated Statements: The income statement, balance sheet, and cash flow statement must be dynamically linked. This is a non-negotiable requirement of financial integrity. It ensures a change in a key driver—such as a 25 basis point increase in the provision for credit losses—flows correctly through net income, retained earnings, and cash reserves.
The following table distinguishes between a conventional spreadsheet and a strategic tool built for executive leadership.
Core Components of a Strategic Financial Model
This table outlines the essential building blocks of a robust financial model, shifting the focus from mere calculation to strategic utility for bank leadership.
| Component | Traditional Focus | Strategic Executive Focus |
|---|---|---|
| Inputs & Assumptions | Historical averages, static growth rates. | Key business drivers (e.g., loan volume, deposit mix, fee income), market-based scenarios. |
| Financial Statements | Standalone, often manually linked statements. | Fully integrated three-statement model (Income, Balance Sheet, Cash Flow) for consistency. |
| Scenario Analysis | Basic best-case/worst-case scenarios. | Dynamic, multi-variable sensitivity analysis; stress testing against specific economic events. |
| Output & Visualization | Dense data tables, complex spreadsheets. | Clear dashboards, charts, and executive summaries focused on KPIs and strategic implications. |
Ultimately, a model built for strategic insight provides a clear, defensible narrative that the entire leadership team can understand and act upon.
A model's true value is measured by the quality of the executive conversation it facilitates. If it doesn't provide clarity on risk, opportunity, and the financial impact of strategic choices, it's merely a complex calculation.
Knowing how to build financial models is less about formula proficiency and more about translating business strategy into a logical, defensible financial narrative. Mastering the fundamentals is paramount.

Defining Your Model's Core Assumptions
The strategic value of any financial model rests entirely on the credibility of its assumptions. Without a disciplined, data-driven approach to inputs, the most sophisticated spreadsheet is a house of cards—impressive in its complexity but certain to collapse under scrutiny from the board.
The objective is not to find numbers to populate cells, but to build a defensible foundation for every projection. Generic, top-down benchmarks are a common and critical error. Relying on national averages for metrics like deposit runoff or loan growth introduces an unacceptable margin of error. A bank competes in specific regional markets against a known set of peers; its assumptions must reflect that reality.

Sourcing Granular Data for Defensible Inputs
An actionable model sources granular, institution-specific data. Instead of relying on broad industry reports, executives must insist on intelligence that mirrors their unique operating environment. This is precisely where a platform like Visbanking becomes mission-critical, enabling leadership to anchor assumptions in hard evidence drawn from direct competitors.
Consider a practical example: modeling deposit sensitivity. A generic assumption might suggest a deposit beta of 0.4, implying deposit costs rise by 40 basis points for every 100-basis-point hike in the fed funds rate. However, a peer data analysis via Visbanking might reveal that banks of a similar size in your primary market exhibit an average beta of 0.55 due to aggressive local competition. That 15-basis-point difference is not trivial. Building a model with the peer-benchmarked beta of 0.55 provides a far more realistic projection of net interest margin compression, informing a proactive funding strategy rather than a reactive scramble for liquidity.
Systematizing Key Assumption Categories
A robust model demands a systematic approach. Assumptions across all core performance drivers must be defined and documented with their source and rationale, creating a transparent audit trail for regulators and the board.
Key areas requiring meticulous, data-backed detail include:
- Balance Sheet Growth: Loan and deposit growth must be a bottom-up exercise. A projection of 5% loan growth is meaningless without specifying which portfolios (C&I, CRE, consumer) are driving it and why, supported by analysis of product pipelines and local economic forecasts.
- Net Interest Margin (NIM): NIM assumptions are a function of asset yields and funding costs. This requires detailed forecasts for loan repricing, investment portfolio yields, and cost of funds—including the stability of non-interest-bearing deposits benchmarked against peers.
- Non-Interest Income: Deconstruct this category. Instead of a blanket growth rate, detail projections by source (service charges, wealth management fees, mortgage banking). The model should reflect specific initiatives, such as a new treasury management product projected to generate $500,000 in new annual fee income.
- Operating Expenses: Look beyond simple inflation adjustments. Expense assumptions must account for strategic investments in technology, planned headcount changes, and branch network optimization. A planned core system upgrade, for instance, might increase tech expenses by 12% in year one but generate offsetting efficiency gains in subsequent years.
A model's assumptions are not just inputs; they are a narrative of your strategy. Each number should correspond to a specific business decision, market condition, or competitive pressure, ensuring the final output tells a coherent and defensible story.
The Importance of Documentation and Transparency
Finally, every assumption must reside in a dedicated, clearly labeled section of the model. Hard-coding numbers directly into formulas is a cardinal sin of financial modeling, as it destroys transparency and introduces unacceptable risk. Centralizing assumptions facilitates seamless scenario analysis and ensures any member of the leadership team can understand the logic behind the forecast.
This is not a best practice; it is essential for credibility. Before the board or regulators, the ability to trace every output back to a well-reasoned and externally benchmarked assumption is what distinguishes a strategic tool from a speculative exercise.
Building the Model's Engine: The Integrated Financial Statements
With assumptions defined and validated, the next phase is constructing the model's architecture. This is where the spreadsheet transitions from a static ledger to a dynamic engine for strategic analysis. For a bank executive, the integrity of this structure is non-negotiable, as it ensures that the full financial impact of any decision is accurately reflected across the institution.
At the core of any credible financial model are the three integrated statements: the Income Statement, the Balance Sheet, and the Cash Flow Statement. They are not separate documents but a single, interconnected financial narrative.
This diagram illustrates the workflow, from historical data validation to forecasting and scenario analysis.
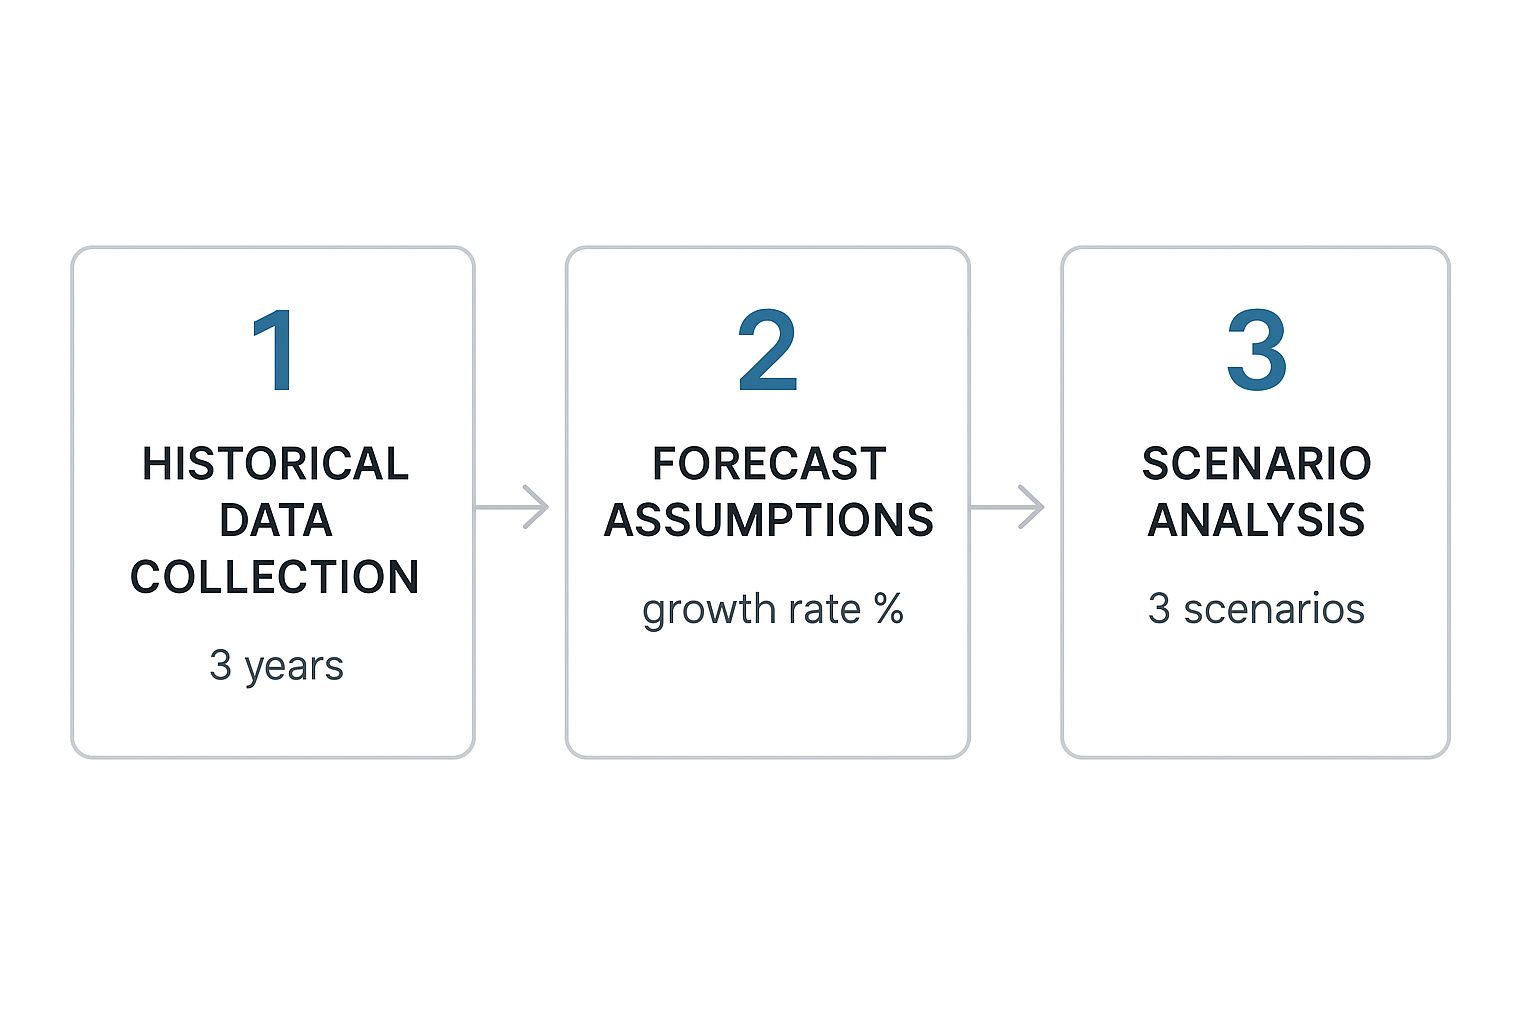
Robust scenario analysis is impossible without a solid foundation of validated historicals and well-defined assumptions.
The Logic That Holds It All Together
The connections between the three statements are governed by fundamental accounting principles, and the model must enforce these links with absolute precision. A single broken link renders the model's output unreliable and undermines its strategic value.
The critical linkages are:
- Net Income to Retained Earnings: Net Income, the final line of the Income Statement, flows directly into the Retained Earnings account on the Balance Sheet. This is the primary link between profitability and the bank's capital position.
- Balance Sheet Changes to Cash Flow: The Cash Flow Statement begins with Net Income and adjusts for non-cash items (e.g., depreciation) and changes in balance sheet accounts. These changes are derived directly by comparing the current period's Balance Sheet to the prior period's.
- Ending Cash Back to the Balance Sheet: The final Ending Cash balance from the Cash Flow Statement must link back to the "Cash and Cash Equivalents" line on the current period's Balance Sheet. This is the final check; if Assets = Liabilities + Equity, the model balances.
A model that doesn't balance is worse than having no model at all. It provides a false sense of security that can lead to catastrophic strategic decisions. An automated balance check at the bottom of the balance sheet is mandatory.
Keep It Clean: The Power of Supporting Schedules
A common modeling error is cramming all calculations into the main financial statements, creating a cluttered and indecipherable result. An executive-level view must be clean and intuitive.
The granular calculations that drive key line items belong in separate, clearly labeled supporting schedules. This modular approach provides both clarity and control. For instance, Net Interest Income is not an input; it is the output of a detailed schedule.
Example: Your Loan Portfolio Schedule
A loan portfolio schedule is essential. The portfolio should be broken down by type (Commercial Real Estate, C&I, Residential Mortgage) and map the following for each period:
- Beginning Balance: Pulled from the prior period's ending balance.
- New Originations: Driven by growth assumptions (e.g., a $50 million increase in CRE lending next quarter).
- Paydowns & Runoff: Calculated based on historical amortization and prepayment speeds.
- Ending Balance: The sum of the above, which feeds the "Total Loans" line on the Balance Sheet.
- Average Balance: Calculated to determine interest income for the period.
- Yield Assumption: Pulled from interest rate forecasts.
- Interest Income: Calculated as Average Balance multiplied by the Yield. This output links directly to the "Interest and Fee Income on Loans" line on the Income Statement.
This modular structure allows a single driver—such as the CRE origination forecast—to be adjusted, with the impact flowing seamlessly through the Balance Sheet, Income Statement, and Cash Flow Statement. Similar schedules are required for the securities portfolio, deposits, and other material drivers. For further detail, review our a deep dive into bank financial statements.
This disciplined structure ensures the model is accurate, auditable, and adaptable, empowering leadership to test detailed strategic ideas without being overwhelmed by complexity.
Stress Testing and Scenario Analysis
A static financial forecast is a strategic liability. Its value is limited to a single point in time in an uncertain economy. A model’s true power is unleashed when it is used to map risk and opportunity through rigorous stress testing and scenario analysis. For bank leadership, this is not an academic exercise; it is about quantifying the impact of potential economic futures to answer the board's toughest questions with data, not intuition.

Building Robust Scenarios
Scenarios must be both plausible and severe enough to be meaningful. This requires moving beyond vague "best-case" and "worst-case" labels and tying models to specific, quantifiable economic events.
Practical scenarios every bank should be modeling include:
- Interest Rate Shocks: What is the impact of a sudden, parallel 100-basis-point upward shift in the yield curve on Net Interest Margin (NIM)? What is the corresponding mark-to-market loss on the AFS securities portfolio and the resulting impact on tangible common equity?
- Credit Cycle Downturn: Stress the loan portfolio against a sharp rise in local unemployment. If unemployment in the primary lending area increases from 3.5% to 6.0%, what is the projected increase in net charge-offs, and what is the consequent impact on the loan loss provision and capital ratios?
- Deposit Outflow Scenarios: Model a scenario where 10% of non-relationship deposits exit the bank over 90 days. Can the institution fund this outflow without liquidating assets at a loss or borrowing at punitive rates from the FHLB?
These analyses are direct measures of the bank's resilience.
The Role of Data Intelligence in Scenario Design
To build credible scenarios, external benchmarks are essential. Internal historical data alone can create an echo chamber, leading to a dangerous institutional blind spot. This is where data intelligence platforms like Visbanking are indispensable, grounding assumptions in the reality of the competitive landscape.
Consider the critical assumption of deposit beta. Internal data might suggest a low beta. However, peer analysis may reveal that high-performing banks in your market are experiencing much higher betas as they compete aggressively for funding.
Basing an interest rate shock scenario on an internally derived deposit beta of 0.30 when aggressive peers are already at 0.50 is a critical strategic error. An accurate model must reflect the market in which you actually compete.
Using peer-validated data provides a far more realistic picture of potential NIM compression, enabling proactive balance sheet management.
Implementing Sensitivity Analysis
While scenario analysis tests broad economic narratives, sensitivity analysis is a surgical tool. It isolates a single driver to measure its precise impact on a specific outcome, identifying the assumptions that carry the most weight.
For example, an executive must know the precise impact of loan growth on earnings per share (EPS).
Hypothetical Example: Loan Growth Sensitivity
- Base Case: The model assumes 5% annual loan growth, resulting in a projected EPS of $4.00.
- Sensitivity Test: A data table is constructed to toggle the loan growth assumption in 1% increments, from 2% to 8%.
- The Output: The model reveals that for every 1% increase in loan growth, EPS increases by $0.12.
This provides the board with a clear, direct takeaway: "Our strategy to expand commercial lending is projected to add twelve cents to EPS for every percentage point of growth achieved." This granular insight transforms the financial model from a forecasting tool into a decision-making engine. Integrating robust bank stress testing models is a core component, providing a framework to quantify risks beyond the standard forecast.
Ultimately, the objective is to build institutional resilience by understanding the breaking points of the current strategy and preparing leadership to act decisively.
Getting Your Model Ready for the Real World
An unvalidated financial model is an institutional liability. It can misdirect capital allocation, misrepresent risk to the board, and destroy shareholder value. After construction, the model must be subjected to rigorous testing to ensure it is not just mathematically correct but also tells a credible business story.
First, a Sanity Check: Does the Math Work?
This is the basic mechanical audit. The balance sheet must balance to the penny in every period. A small rounding error often indicates a deeper structural problem. The net change in cash on the cash flow statement must perfectly match the change in cash on the balance sheet.
Once mechanical integrity is confirmed, validate the model's logic against historical performance.
- Look Backwards: Input historical data and assumptions. Does the model's output reasonably approximate actual historical results? A model that cannot explain the past has no credibility in predicting the future.
- Check the Logic: Evaluate cause-and-effect relationships. Does a projected increase in loan originations correspond with a logical increase in both interest income and the provision for credit losses? Every input must be connected to the appropriate outputs.
Does Your Model Live on Planet Earth?
Internal consistency is only half the battle. The model's projections must be benchmarked against the real world to expose wishful thinking. A model showing your bank significantly outperforming all peers during a downturn will face intense scrutiny from the board and regulators.
This is why objective, external data is non-negotiable. It provides the necessary check against internal biases.
Your team must be able to defend the narrative the model tells. If your model projects a Return on Assets (ROA) of 1.5% while your peer group average is 1.1%, you must have a data-backed explanation. Is it a superior efficiency ratio? A more profitable loan mix? Without that context, the projection is unsubstantiated.
Consider this scenario: your model forecasts a Net Interest Margin (NIM) expansion of 15 basis points. A data intelligence tool like Visbanking shows that every peer in your region is forecasting NIM compression due to rising funding costs. This discrepancy does not automatically mean your forecast is wrong, but it forces a critical strategic question: What are we doing differently and more effectively than our competitors?
It’s Not a Spreadsheet; It’s a Strategy
A 30-tab spreadsheet is not an insight. The ultimate test is whether the model drives intelligent action. The final step is to distill its complexity into a clear, compelling narrative for leadership.
Use charts and dashboards to illustrate trends in capital ratios, EPS, and tangible book value under different scenarios. The presentation must answer the critical questions:
- What are the primary risks and opportunities identified by the model?
- Which assumptions carry the most weight in our forecast?
- Based on this analysis, what is our recommended course of action?
This transforms the model from a number-crunching exercise into a powerful tool for strategic decision-making, providing the board with the foresight to navigate future challenges with confidence. To ensure your model’s outputs are grounded in reality, you must benchmark your projections against your peers. Explore how our data can provide the external validation needed to build truly strategic financial models.
A Few Common Questions About Bank Financial Modeling
When building a financial model, it's easy to get lost in the technical details. Executive leadership, however, is focused on a single question: will this model improve our decision-making?
Here are answers to the most common questions from bank directors and executives.
How Often Should We Be Updating Our Financial Model?
A static annual model is a relic of a bygone era. The core strategic model must be updated at least quarterly to track performance against budget and, more importantly, to respond to evolving market conditions.
Key assumptions, however, require more frequent review. Interest rate forecasts, credit quality indicators, and competitive deposit pricing must be re-evaluated monthly, or more often in volatile periods. The model should function as a living component of the strategy team, not as a static report.
What's the Single Biggest Mistake You See in Bank Modeling?
Relying exclusively on internal historical data without benchmarking against the external market. This practice creates a dangerous echo chamber. Without pressure-testing assumptions against peer performance and broader economic data, leadership can be blindsided.
For example, a bank may assume its deposit costs will remain low based on historical experience, while competitors are aggressively raising rates to attract funding. This oversight leads directly to margin compression and franchise erosion. Effective modeling must incorporate external data from platforms like Visbanking to provide unbiased, real-world context and ensure internal views are grounded in reality.
The real power of a model isn’t in the spreadsheet itself—it's in the conversations it forces you to have. If it’s not sparking debate about capital, profitability, and competitive threats, it’s not doing its job.
How Do We Keep the Model from Getting Too Complicated for the Board?
Focus on the narrative, not the mechanics. The board does not require a line-by-line review of formulas. They need clear, visual outputs that connect potential scenarios to the bank's strategic objectives. Replace raw data tables with executive summaries and dashboards that directly answer their "what if" questions.
Technology is amplifying this capability. AI and automation are transforming how models are built and used. According to recent industry analysis, an estimated 85% of financial institutions will utilize AI in their modeling by 2025. This enables the presentation of a full spectrum of probable outcomes, not just a single forecast, turning a complex spreadsheet into a powerful tool for confident decision-making.
At Visbanking, our purpose is to provide the external market intelligence that ensures your financial models are grounded in reality. To see how your performance and assumptions compare to the competition, Explore our data and begin building a strategy equipped for any market condition.
Latest Articles

Brian's Banking Blog
What Is Market Penetration and How Banks Can Measure It

Brian's Banking Blog
Revenue Growth Strategies: 10 Data-Driven Tactics for Banks

Brian's Banking Blog
What Is Historical Analysis? a Banker's Working Definition

Brian's Banking Blog
Customer Churn Prediction: A Practical Guide for Banks

Brian's Banking Blog
Social Network Analysis for Banking: A Practical Guide

Brian's Banking Blog