How to Analyze Financial Statements to Drive Banking Decisions
Brian's Banking Blog
Analyzing financial statements is not an academic exercise for bank executives and directors. It is the bedrock of strategic leadership. The objective is to move beyond mere compliance and dissect the balance sheet, income statement, and cash flow statement to uncover actionable intelligence that drives performance, manages risk, and builds a sustainable competitive advantage.
The goal is to translate raw data into a clear, unvarnished assessment of your bank’s financial health, risk profile, and competitive positioning. This guide provides a framework for executives to do just that.

Why Financial Statement Analysis is an Executive Mandate
For a bank's leadership, the ability to dissect financial statements is not a technical skill to be delegated; it is a core competency of strategic governance. In a market defined by compressed margins and economic volatility, this capability separates market leaders from the pack.
This analysis is not about historical record-keeping; it is about steering the bank's future. Financial statements are predictive tools. This guide is built for the executives and directors who must look beyond surface-level numbers to understand the why behind them and make decisions that create shareholder value.
Decoding the Three Core Statements
Each statement provides a unique lens on the institution. They are interconnected, and a holistic understanding requires synthesizing insights from all three. For a more granular examination of a single component, this guide on how to analyze a balance sheet is a useful primer.
Here is a functional breakdown of the "big three" from a bank leadership perspective.
| Key Financial Statements at a Glance |
| :--- | :--- | :--- |
| Financial Statement | Primary Purpose | Key Questions Answered for a Bank |
| Balance Sheet | A snapshot of financial position at a single point in time. | What is the composition of our assets (loans, securities)? What is our funding mix (deposits, debt)? What is our capital position? |
| Income Statement | Measures profitability over a specific period. | Are we generating sufficient returns from our core operations? How are interest and non-interest income/expense trends impacting the bottom line? |
| Cash Flow Statement | Tracks the movement of cash between operating, investing, and financing activities. | Where is our cash originating, and where is it being deployed? How robust is our operational liquidity? |
The analytical power lies not in reviewing these statements in isolation, but in weaving their narratives together.
Key Takeaway: No single statement tells the whole story. Real analytical power comes from synthesizing insights across all three to build a complete picture of performance, risk, and strategic direction.
This integrated analysis is critical in a dynamic economic environment. For instance, as U.S. consumer debt levels fluctuate, a bank's board must assess the direct impact on its loan portfolio quality and provisions for credit losses.
Similarly, shifting interest rate environments directly impact Net Interest Margin and Return on Assets. Scrutinizing these trends is essential for preempting profitability shifts. This is precisely why data intelligence platforms like Visbanking, which provide immediate, contextual peer comparisons, have become indispensable tools for turning data into a decisive competitive advantage.
Mastering Ratios That Drive Bank Performance

Financial ratios are the language of banking strategy. For executives and directors, they are not abstract metrics but direct measures of strategic execution. They answer the fundamental questions: Are we profitable? Are we operationally efficient? Do we possess the capital to withstand stress and fund growth?
True financial statement analysis for banks emerges when these ratios are benchmarked against direct competitors. This comparative context is what reveals strategic gaps and opportunities that an isolated number would obscure.
Profitability: The Ultimate Report Card
Profitability ratios are the definitive measure of how effectively management is converting revenue, assets, and equity into earnings.
Return on Average Assets (ROAA) is the paramount profitability metric for a bank, indicating how efficiently management is using assets to generate profit. An ROAA of 1.00% is a widely accepted benchmark, but its meaning is derived entirely from context.
Consider a $2 billion community bank with an ROAA of 0.85%. In isolation, this may appear subpar. However, if its peer group of similarly sized regional banks averages 0.75%, the bank is not an underperformer; it is a market leader. Context is everything.
Net Interest Margin (NIM) is the lifeblood of banking. It is the spread between interest income earned on assets and interest expense paid on liabilities, measured as a percentage of earning assets.
A marginal shift in NIM has a material impact. For a $5 billion bank, a 10 basis point (0.10%) decline in NIM can reduce pre-tax income by $5 million. This is why monitoring NIM relative to peers is a critical executive function.
Efficiency and Operational Excellence
With margins under perpetual pressure, operational excellence is a key strategic differentiator. Efficiency ratios measure how effectively a bank manages its expenses to generate revenue. A lower ratio signifies greater efficiency.
The primary metric is the Efficiency Ratio, which calculates the cost to generate one dollar of revenue. A ratio of 50% means 50 cents are spent to earn each dollar.
Compare two $3 billion banks:
- Bank A operates at a 62% efficiency ratio.
- Bank B operates at 55%.
Bank B demonstrates superior operational discipline, which could stem from technology adoption, streamlined processes, or a more optimized organizational structure. For Bank A’s board, that 7% gap must prompt immediate inquiry: Is our higher cost structure funding strategic investments or indicative of operational drag?
Capital Adequacy and Risk Management
Capital is a bank's financial buffer against unexpected losses. Capital adequacy ratios are a cornerstone of regulatory oversight and a true measure of institutional resilience.
The Tier 1 Capital Ratio is the preeminent metric, comparing a bank's highest-quality capital against its risk-weighted assets (RWAs). It quantifies the bank’s capacity to absorb losses without jeopardizing solvency.
Imagine a bank planning an aggressive expansion into a new commercial lending vertical. This move will increase RWAs. Modeling the impact on capital is not an academic exercise; it is a prerequisite for a sound decision.
- Current Tier 1 Capital Ratio: 11.5%
- Projected Ratio After Expansion: 10.2%
While 10.2% remains well above the 8% regulatory minimum to be considered "well-capitalized," the decline demands a board-level discussion. Does the potential return justify the erosion of our capital buffer? How does our projected ratio compare to peers already operating in this market? This elevates the conversation from "can we?" to "should we?"
Ratios are inert until placed in a competitive context. The power comes from dynamic, comparative analysis. This is where intelligence platforms like Visbanking become indispensable, allowing executives to benchmark these critical metrics against curated peer groups in real time. Instead of waiting for quarterly call reports to be manually compiled, you can instantly see how your NIM, ROAA, and efficiency stack up, turning static data into a decisive strategic advantage.
Uncovering Trends with Horizontal and Vertical Analysis
Ratio analysis provides a snapshot, but it is static. To understand how to analyze financial statements for a strategic edge, you must evaluate performance over time and deconstruct your bank’s internal composition. This is the domain of horizontal and vertical analysis.
These techniques move analysis from observation to interpretation. As one bank CFO noted, "Horizontal analysis tells you where you’ve been; vertical analysis tells you what you prioritize." Together, they reveal the strategic trajectory and operational structure of the institution.
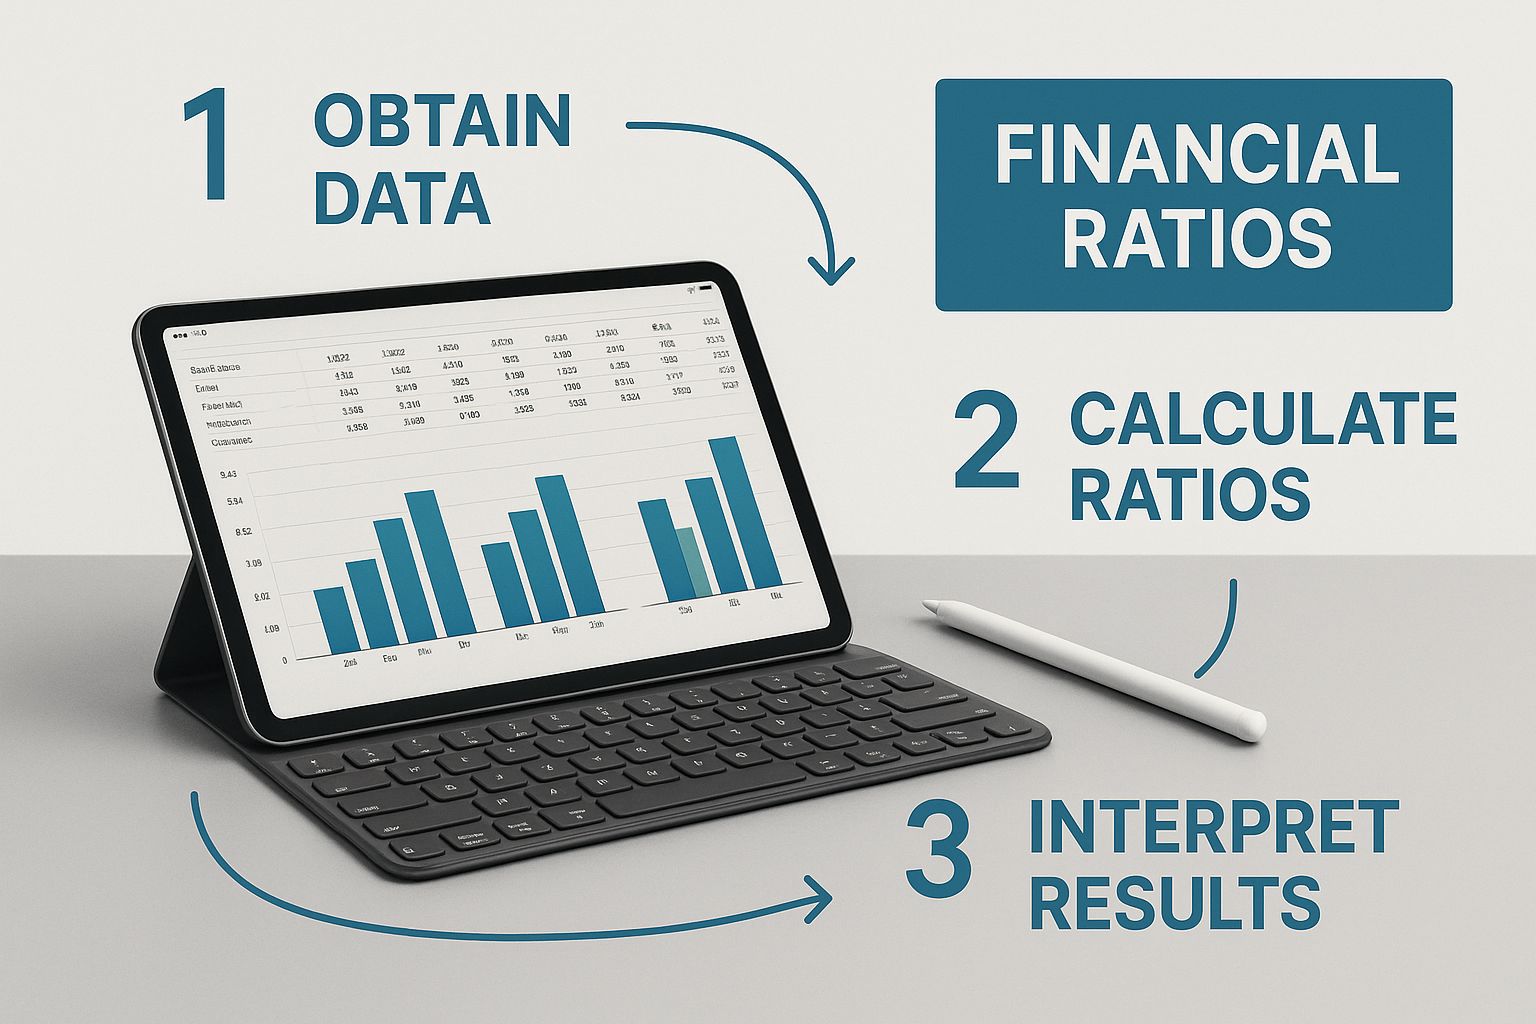
Data visualization, as shown above, immediately places raw numbers into a comparative context, enabling rapid identification of outliers and trends in key financial ratios.
Horizontal Analysis: Diagnosing Margin Pressure
Horizontal analysis, or trend analysis, compares line items across multiple periods. It answers the critical question: Are we moving in the right direction? It is a diagnostic tool that pinpoints the source of performance shifts.
Examine this income statement data for a hypothetical $1.8 billion community bank:
| Income Statement Line Item | Year 1 | Year 2 | Change ($) | Change (%) |
|---|---|---|---|---|
| Total Interest Income | $72M | $75.6M | +$3.6M | +5.0% |
| Total Interest Expense | $18M | $20.7M | +$2.7M | +15.0% |
| Net Interest Income | $54M | $54.9M | +$0.9M | +1.7% |
While Net Interest Income grew, the horizontal analysis reveals a critical vulnerability: Interest expense is growing three times faster than interest income. This is a clear indicator of margin compression, an insight that should trigger immediate board-level discussions regarding the bank's funding mix, asset pricing strategy, and interest rate risk exposure.
Vertical Analysis: Revealing Strategic Priorities
While horizontal analysis looks across time, vertical analysis looks within a single period. This common-size analysis expresses each line item as a percentage of a base figure—typically total assets on the balance sheet or total revenue on the income statement.
This technique is exceptionally powerful for decoding a bank's strategic DNA, exposing resource allocation and concentration risks. For a deeper examination of balance sheet structure, our guide on how to read a bank's balance sheet provides valuable context.
Consider this vertical analysis of a bank’s asset portfolio:
- Year 1: Commercial Loans constitute 45% of Total Assets; Residential Mortgages are 35%.
- Year 2: Commercial Loans have grown to 52% of Total Assets; Residential Mortgages have declined to 28%.
This shift represents a deliberate strategic pivot toward commercial lending. This has material implications for risk management, capital planning, and future earnings potential that would be missed by reviewing dollar values alone.
Key Takeaway for Executives: Vertical analysis of your balance sheet isn't just a financial exercise; it's a referendum on your strategy. It shows exactly where you are placing your bets—a critical piece of information for any director.
From Manual Calculation to Strategic Intelligence
Manual analysis is time-consuming and prone to error. Crucially, it lacks external context. Knowing your interest expense grew by 15% is an observation. Knowing it grew by 15% while your peer group’s grew by only 8% is intelligence.
This is the gap platforms like Visbanking’s BIAS tool are engineered to fill. It automates horizontal and vertical analyses and, most importantly, benchmarks the results against curated peer groups instantly. Instead of spending hours in spreadsheets, executives can proceed directly to the strategic implications—diagnosing performance gaps and identifying opportunities hidden in the data. This is how financial analysis evolves from a backward-looking exercise into a forward-looking strategic weapon.
Looking Beyond the Numbers: Integrating Qualitative Insights
Financial statements provide the skeleton of a bank’s story, but they lack a pulse. Analysis confined to quantitative data—ratios and trends—is incomplete. The most incisive executive decisions integrate this hard data with the qualitative context: the strategic rationale, regulatory landscape, and economic currents shaping the market. The numbers tell you what happened; qualitative context tells you why.
The Real Story is in the MD&A
The Management's Discussion and Analysis (MD&A) section of a financial report is where leadership provides its narrative of the bank's performance and outlook. This is often the most valuable source of forward-looking intelligence.
When reviewing an MD&A, executives should be hunting for specific insights:
- Identified Risks: What are management's primary concerns? Credit risk in commercial real estate? Interest rate volatility? The operational threat of a cyber-attack? These disclosures reveal their strategic priorities.
- Strategic Investments: Where is the bank deploying capital for growth? Expansion into new markets, a wealth management build-out, or technology modernization?
- Management Tone: Is the narrative confident or cautious? The tone can be as revealing as the financial forecasts.
For example, if the MD&A highlights a major investment in digital banking to reduce branch operating costs, that provides a direct analytical thread. An executive should anticipate an initial increase in non-interest expense (the investment), followed by a gradual decline in subsequent periods (the payoff), all while benchmarking the bank's Efficiency Ratio against peers who have made similar investments.
Connecting Your Bank to the Bigger Picture
A bank's performance is inextricably linked to macroeconomic and industry trends. A strategic analysis must look beyond the institution's walls.
Consider the global shift toward digital banking. This is not just a customer convenience trend; it is a fundamental force reshaping financial statements. The rise of digital financial services is a powerful global driver, particularly in developing economies where 40% of adults now use formal financial accounts, largely due to digital access, as detailed in reports from the World Bank.
As a banking leader, you must ask: How is this global trend reflected on our balance sheet and income statement? Are we seeing growth in digital-related fee income? Are our IT and cybersecurity costs escalating, putting pressure on non-interest expense?
A competitor may currently boast a superior efficiency ratio. But if their MD&A reveals a lack of technology investment, their short-term operational "win" may be masking a long-term strategic vulnerability.
This is where a tool like Visbanking’s BIAS provides a distinct advantage. It doesn't just provide a competitor's Net Interest Margin; it allows you to overlay that quantitative data with the qualitative context from their public filings and market commentary. This integrated view enables you to benchmark strategy, not just performance. By comparing your bank's qualitative initiatives and risk assessments against a tailored peer group, you can validate your strategic path or identify a blind spot before it becomes a liability.
Turning Financial Analysis Into Strategic Action
Analysis that does not culminate in a decision is an intellectual exercise with no value to the enterprise. The purpose of financial statement analysis is to inform a strategic action that creates a competitive advantage. This is where leadership bridges the gap between data and execution.
Ratio, trend, and qualitative analyses are not disparate tasks but convergent streams of intelligence. When synthesized, they provide a clear strategic vector, translating insight into a tangible real-world advantage.
From Data Point to Decision
Consider a common scenario: quarterly peer data reveals your bank's efficiency ratio has risen to 61%. While not alarming in isolation, your direct peer group is operating at an average of 56%.
This 5% gap is not a statistic; it is a direct threat to profitability. The peer context transforms the data point into a call for action, prompting a series of critical questions:
- Is the variance in non-interest expense driven by personnel costs, technology spend, or marketing initiatives?
- Are peers achieving superior efficiency through automation, or are they under-investing in critical areas?
- How does this cost structure impact our ability to price loans and deposits competitively?
The efficiency ratio was the signal. A vertical analysis of the income statement identifies the source: personnel costs as a percentage of revenue are 8% higher than the peer average. The problem is no longer "high expenses" but a specific operational inefficiency.
This is how data informs action. A high-level benchmark leads to a targeted analysis that uncovers a root cause, which in turn enables a concrete, measurable plan. The vague concern, "Our expenses are too high," becomes a specific initiative: "We will invest $2 million in process automation to reduce manual overhead in our loan operations by 15% over the next 18 months."
A firm grasp of what the efficiency ratio tells you about a bank is fundamental to making these calls.
Synthesizing Findings for a Cohesive Strategy
A robust strategy cannot be built on a single data point. Effective leaders weave disparate findings into a cohesive narrative. An anomaly can be a fluke; a pattern of interconnected insights is a mandate for action.
The objective is to connect analytical findings to strategic imperatives. The following table illustrates how this synthesis works in practice.
Translating Analysis into Strategic Action
| Analytical Finding | Potential Implication | Resulting Strategic Action |
|---|---|---|
| Declining Net Interest Margin (NIM) compared to peers. | Competitors have a more favorable funding mix or superior asset pricing. | Launch a targeted campaign to attract low-cost core deposits and re-evaluate loan pricing models. |
| Growing concentration in Commercial Real Estate loans (Vertical Analysis). | Increased exposure to a single sector risk. | Tighten underwriting standards for new CRE loans and explore diversification into C&I or other asset classes. |
| MD&A commentary from peers indicates aggressive tech spending. | Your bank may be falling behind in digital capabilities, impacting future efficiency. | Allocate capital for a core system upgrade or a partnership with a fintech provider to enhance digital offerings. |
Each action is a direct, defensible response to data. This is how you achieve board and executive alignment around a clear strategic plan. These insights are also critical when determining how to value a business for M&A or capital planning.
The analytical cycle is about building an evidentiary foundation for decision-making. Whether the goal is risk mitigation, growth, or operational improvement, the quality of your decisions is predicated on the quality of your analysis. When you can benchmark performance, identify specific opportunities, and translate complex financial data into a clear roadmap, you have weaponized compliance into a competitive advantage. This is the strategic function that platforms like Visbanking are built to accelerate.
Answering Your Board's Toughest Questions
As a banking leader, you are accountable for the institution’s strategic direction. A deep, intuitive command of your financial statements is about having definitive answers when the stakes are highest.
Let's address the essential questions.
Which Financial Statement Really Matters Most for a Bank?
All three are critical, but the Balance Sheet is the center of gravity for a bank. It is the direct representation of our business model: acquiring liabilities (deposits) to fund assets (loans). The health of the loan portfolio, the cost and composition of funding, and the strength of our capital base all reside on the balance sheet.
However, viewing it in isolation is a critical error.
- The Income Statement reveals whether that balance sheet composition is profitable, detailing the Net Interest Margin and operational performance.
- The Cash Flow Statement provides the ultimate measure of liquidity, tracking the actual movement of cash.
The most powerful insights arise from connecting the three. A decision to acquire a loan portfolio (a balance sheet action) must be traceable to its impact on the income statement and cash flow statement.
How Often Should We Be Looking at Peer Financials?
Quarterly reviews are the minimum standard, aligning with the rhythm of regulatory filings. This provides a regular checkpoint against key competitors.
The strategic edge, however, is gained by going deeper. At least twice annually, the leadership team and board should conduct an in-depth peer analysis to identify larger trends in strategy, risk, and operational execution before they become immediate threats.
The best practice is continuous monitoring. A dynamic intelligence tool allows for near real-time tracking of peer activities, enabling strategic agility.
What's the Single Biggest Mistake You See in Financial Analysis?
Viewing a number in isolation. A data point without context is noise. An efficiency ratio of 58% or loan growth of 10% is meaningless on its own.
Data becomes intelligence only when contextualized:
- Against your own history (Horizontal Analysis): How does this period compare to prior periods?
- Against your own operations (Vertical Analysis): What internal factors are driving this number?
- Against your competition (Peer Benchmarking): How does this metric compare to the banks we compete against for every loan and deposit?
Context transforms a number into a strategic tool. An ROAA of 0.90% may seem adequate, but if your direct peer group is averaging 1.15%, the perspective must shift from adequacy to urgency. You are underperforming the market. Without that benchmark, you risk rewarding performance that is falling behind.
Turning sharp analysis into decisive action is what separates market leaders from the rest. At Visbanking, we build data intelligence tools that empower bank executives to benchmark performance, identify opportunities, and translate complex data into clear, actionable strategy. See how our BIAS platform can give you that competitive edge.
Latest Articles

Brian's Banking Blog
What Is Historical Analysis? a Banker's Working Definition

Brian's Banking Blog
Customer Churn Prediction: A Practical Guide for Banks

Brian's Banking Blog
Social Network Analysis for Banking: A Practical Guide

Brian's Banking Blog
How to Increase ROE: A Data-Driven Playbook for Bank Leaders

Brian's Banking Blog
What Is SEC EDGAR and How Banks Use the Data

Brian's Banking Blog