Financial Statement Analysis for Banks: Expert Tips
Brian's Banking Blog
Decoding Bank Financial Statements: Beyond the Basics
Financial statement analysis for banks isn't your typical corporate deep dive. Banks operate differently, treating loans as assets and deposits as liabilities. This is because they essentially act as financial intermediaries, using deposited funds for lending and investments. Plus, strict regulations add another layer of complexity to their financial reporting, setting bank statements apart from standard corporate financials. This requires analysts to use specific frameworks for accurate interpretation.
Understanding the Unique Nature of Bank Assets and Liabilities
The core of bank financial statement analysis lies in understanding how assets and liabilities are structured. Loans, the heart of banking, make up a large chunk of a bank's assets, generating interest income–a primary revenue source. However, loans come with the inherent risk of default. On the flip side, deposits represent customer funds held by the bank and used for lending. This creates a link between a bank's balance sheet and income statement, as interest rate changes can impact both. Read also: The Money Makers: A Deep Dive into Bank Financial Statements.
The Impact of Interest Rates and Market Capitalization
Interest rate fluctuations are a critical factor in analyzing bank financial statements. Changes in these rates directly impact net interest income, a key profitability metric. Rising rates can boost income from loans but also increase interest expense on deposits. Sound bank analysis hinges on reliable financial reporting. Building trust with customers is crucial, and understanding the principles of building customer trust is essential. Market capitalization trends also provide valuable insights. In Q1 2025, the top 25 global banks experienced a 20.1% year-over-year increase in market cap, hitting $4.7 trillion, mainly due to central bank interest rate cuts. Find more detailed statistics here. This highlights how investor confidence and financial results are reflected in market capitalization.
Key Metrics for Bank Financial Statement Analysis
Specific metrics offer a deeper look into a bank's financial health. Let's break down a few:
- Capital Adequacy Ratios: Metrics like the Common Equity Tier 1 (CET1) ratio measure a bank's ability to absorb losses.
- Liquidity Ratios: The Liquidity Coverage Ratio (LCR), for example, assesses a bank's capacity to meet short-term obligations.
- Profitability Ratios: Return on Assets (ROA) and Return on Equity (ROE) gauge how efficiently a bank generates profits.
These metrics are interconnected. A holistic analysis considers their combined impact. For example, a high ROE might seem positive, but if it's due to excessive leverage, it could indicate higher risk.
To understand the core differences between bank and non-bank financial statements, let's look at a comparison table:
Bank vs. Non-Bank Financial Statement Comparison
This table highlights the key differences between financial statements of banks and non-financial companies
| Statement Component | Bank Financial Statements | Non-Financial Company Statements | Key Implications for Analysis |
|---|---|---|---|
| Assets | Primarily loans and investments | Primarily property, plant, and equipment (PP&E), inventory, and receivables | Different asset composition requires distinct valuation methods and risk assessments. |
| Liabilities | Primarily deposits and borrowings | Primarily accounts payable, debt, and other obligations | The reliance on deposits creates a unique interest rate sensitivity for banks. |
| Revenue | Primarily interest income and fees | Primarily sales revenue | Different revenue drivers require specific profitability analysis. |
| Expenses | Primarily interest expense and operating expenses | Primarily cost of goods sold (COGS) and operating expenses | Interest expense is a major cost component for banks, making interest rate management crucial. |
Analyzing bank financial statements requires a specialized lens due to the unique structure of their assets, liabilities, and revenue streams. By understanding these distinctions, analysts can gain a clearer picture of a bank's financial health and performance.
The Metrics That Actually Matter: Banking Performance Indicators
Analyzing bank financial statements isn't the same as analyzing other industries. Banks need specific metrics that go beyond the usual financial ratios. We need indicators that show a bank's ability to earn, its efficiency, and how much risk it's taking.
Key Profitability and Efficiency Metrics
The Net Interest Margin (NIM) is a vital profitability metric. It shows the difference between the interest earned on loans and investments and the interest paid on deposits. A healthy NIM means the bank is managing interest rate risk well. Efficiency ratios, conversely, show how well a bank manages its operations. A lower efficiency ratio typically means better cost control and, therefore, better profitability.
Return on Assets (ROA) measures how well a bank generates profit from its assets. Higher ROA generally points to stronger profitability. Return on Equity (ROE) measures profitability relative to shareholder investment. A high ROE is usually good, but it's important to understand why it's high. A high ROE driven by a lot of debt might mean higher risk, not necessarily better profitability.
Asset Quality and Risk Assessment
Metrics related to asset quality offer a look at a bank's risk. The non-performing loan ratio shows the percentage of loans that aren't being repaid as agreed. If this ratio increases, it could mean potential losses and future write-offs. Loan loss reserves are funds set aside to cover potential defaults. Comparing these reserves to past losses helps determine if the bank is prepared for future credit losses.
The infographic below shows the connection between the Tier 1 Capital Ratio, Non-Performing Loan Ratio, and Return on Assets. These metrics offer a quick view of a bank's financial strength, asset quality, and profitability.
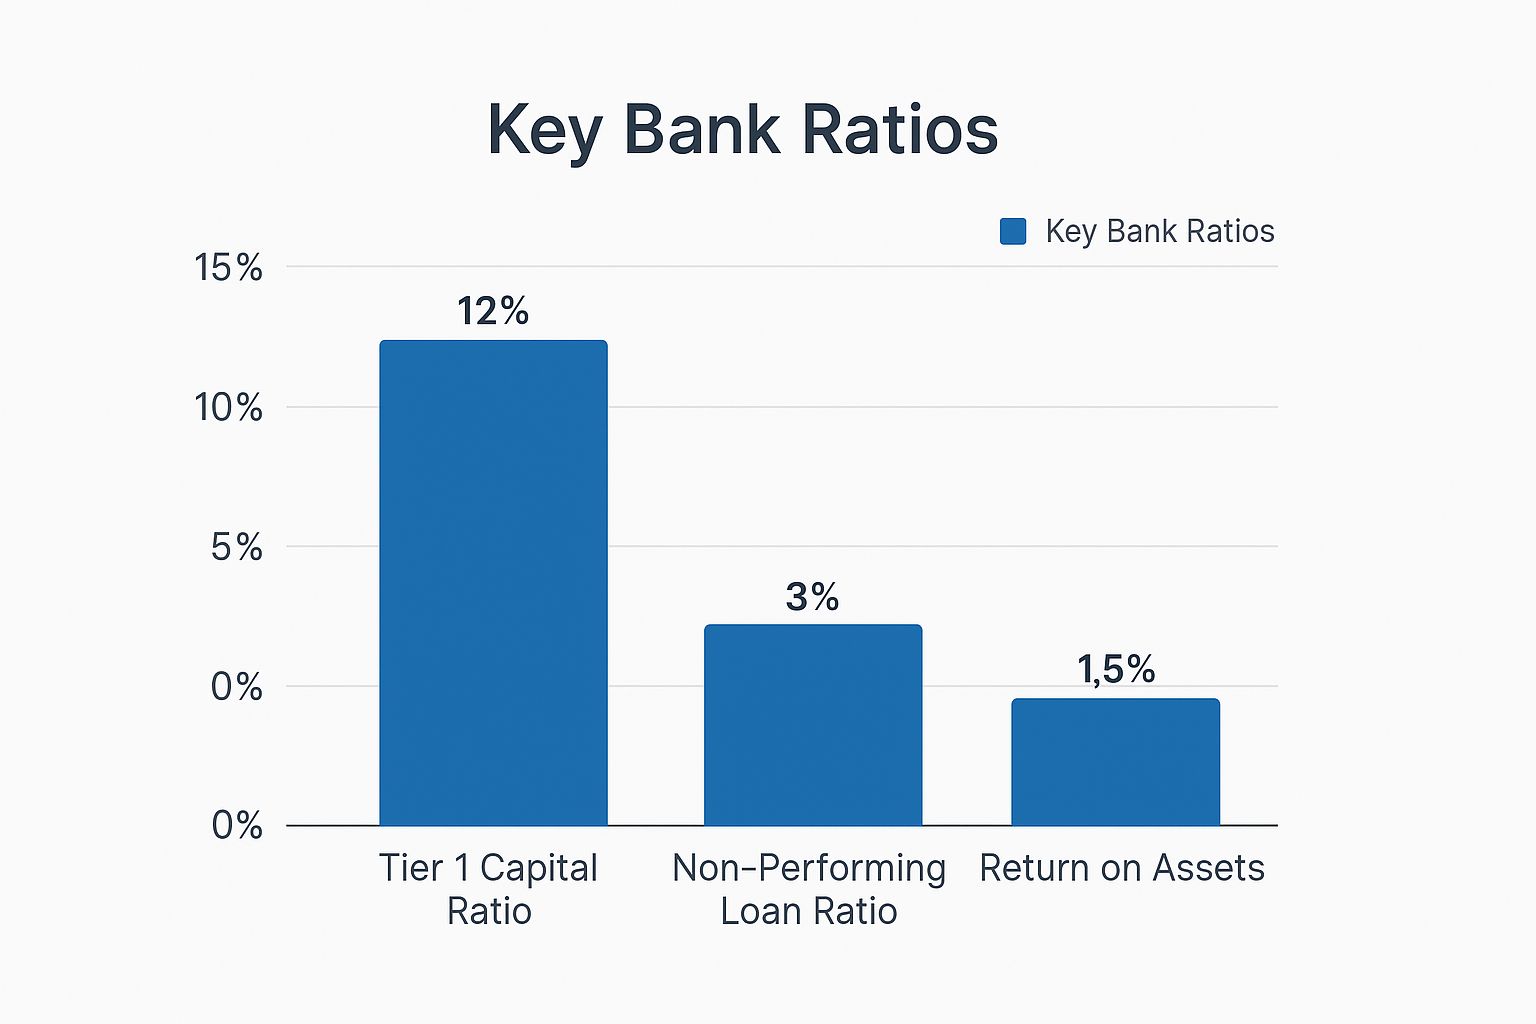
As the infographic illustrates, a strong Tier 1 Capital Ratio (12%) provides a buffer against losses, while a low Non-Performing Loan Ratio (3%) indicates solid asset quality. A 1.5% Return on Assets reflects the bank's profitability based on its assets.
Before diving into loan growth, let's look at some essential banking performance ratios. The following table provides a summary of key ratios, their formulas, typical target ranges, interpretations, and potential warning signs.
Essential Banking Performance Ratios
| Ratio | Formula | Target Range | Interpretation | Warning Signs |
|---|---|---|---|---|
| Net Interest Margin (NIM) | (Interest Income - Interest Expense) / Average Earning Assets | 2.5% - 4% | Measures profitability from core lending activities | Declining NIM, below industry average |
| Efficiency Ratio | Non-Interest Expense / (Net Interest Income + Non-Interest Income) | 50% - 70% | Measures operational efficiency | Increasing ratio, above industry average |
| Return on Assets (ROA) | Net Income / Average Total Assets | 0.8% - 1.5% | Measures overall profitability | Declining ROA, consistently below peers |
| Return on Equity (ROE) | Net Income / Average Shareholder's Equity | 10% - 15% | Measures return to shareholders | Declining ROE, excessively high ROE funded by debt |
| Non-Performing Loan Ratio | Non-Performing Loans / Total Loans | < 2% | Measures asset quality and credit risk | Increasing ratio, significantly above peers |
This table summarizes the key metrics used to evaluate a bank's performance. Maintaining healthy ratios is crucial for long-term stability and success.
Loan Growth and Net Interest Income Dynamics
Loan growth and net interest income (NII) are vital for bank analysis, particularly with fluctuating interest rates. Global loan growth is projected to increase to 6% in 2025, up from 2% in 2024. This projected growth is related to central banks lowering interest rates, which is expected to increase demand for loans. Explore this topic further. For more on the money supply and its effect on banks, see this article: Unveiling the Money Machine: How the Quantity of Money is Controlled and Measured. While banks are currently benefiting from higher interest rates, loan growth will likely be the main driver of NII growth, estimated at 3% in 2025. This is because loan growth directly impacts key profitability metrics.
Benchmarking and Interpreting Performance
Comparing these metrics to similar banks offers important context. However, it's important to consider differing business models and strategies. For example, a retail bank will have a different NIM than an investment bank. Analyzing bank financial statements isn't just about calculating numbers; it's about understanding what those numbers say about management, risk, and long-term sustainability. By understanding these analytical tools, you gain a deeper understanding of a bank's financial health, its operational efficiency, and what its future might look like.
Spotting Credit Risk Before It Explodes: Loan Quality Analysis

Credit quality is the foundation of a healthy bank. Hidden within the financial statements are clues that can predict emerging credit problems. Understanding loan quality analysis is essential for investors and analysts.
Understanding Loan Portfolio Composition and Concentration
Analyzing a bank's loan portfolio composition is crucial. This involves understanding the types of loans held, such as commercial real estate (CRE) loans, commercial and industrial (C&I) loans, and consumer loans (including credit cards and mortgages).
Each loan type carries different risk levels. CRE loans are generally considered riskier than residential mortgages due to their sensitivity to economic fluctuations.
Loan concentration, where a significant portion of loans is in one sector or area, can amplify risk. Problems in that specific sector or region can disproportionately impact the bank’s portfolio.
Evaluating Non-Performing Loans and Loss Reserves
Non-performing loans (NPLs) are loans where borrowers have stopped payments. A rising NPL ratio is a warning sign.
However, even with rising NPLs, a bank can remain safe with adequate loss reserves. These funds are set aside to cover expected loan losses. Analyzing reserve adequacy involves comparing coverage ratios to historical loss patterns and the economic environment.
It’s also important to compare a bank's credit risk exposure to its profitability and capital. S&P Global Ratings projects global bank credit losses to rise by about 7% to US$850 billion in 2025.
This increase is due to declining credit quality in sectors like CRE, C&I loans, and credit cards. Despite this, banks are projected to maintain a 10% to 11% return on equity (ROE) for 2025. Learn more about the global banking outlook.
Recognizing Management’s Outlook and Deteriorating Credit Metrics
Management commentary provides valuable insights. However, it's important to carefully consider management's outlook for potential biases, especially when optimistic projections don't match declining credit metrics.
A bank might downplay rising NPLs by emphasizing strong loan growth, distorting the true credit risk picture. Comparing management's narrative with the underlying data is essential.
Case Studies and Early Warning Signs
Case studies of banks that successfully navigated credit cycles provide valuable lessons. These examples often highlight the importance of conservative underwriting, proactive risk management, and diversified loan portfolios.
Analyzing banks that failed due to credit crises reveals the dangers of excessive risk, inadequate loss provisions, and concentrated portfolios. Studying both successes and failures helps analysts identify early warning signs and differentiate temporary challenges from systemic weaknesses.
Distinguishing Temporary Hiccups From Systemic Portfolio Weaknesses
Not all NPL increases signal a systemic issue. Temporary economic downturns or industry-specific issues can cause short-term fluctuations in asset quality.
Differentiating temporary issues from fundamental weaknesses is crucial. Analyzing loan portfolio diversity, loan concentration risks, historical loss patterns, and current economic conditions provides a comprehensive view of a bank’s true credit risk and helps detect early warning signs.
Fortress or House of Cards? Analyzing Capital & Liquidity

Capital adequacy and liquidity are fundamental to a stable banking system. Yet, these crucial metrics are often misunderstood. This section clarifies how to analyze these vital aspects of bank financial statements.
Demystifying Capital Adequacy Ratios
Capital acts as a buffer against unexpected losses. Key regulatory ratios like Common Equity Tier 1 (CET1), Tier 1, and Total Capital reveal a bank's resilience.
CET1, composed of common stock and retained earnings, is the highest quality capital. Tier 1 capital includes CET1 plus other core capital instruments. Total capital includes Tier 1 plus Tier 2 capital, which includes revaluation reserves and subordinated debt.
These ratios are expressed as percentages of risk-weighted assets, providing a standardized measure of capital strength. You might be interested in: Why Tier 1 Capital Ratio Matters in Banking Regulation and Safety.
Evaluating Funding Structures and Stress Tests
Smart analysts go beyond simply reviewing capital ratios. They consider the composition of the capital base. Is it primarily high-quality common equity or more volatile instruments?
They also analyze funding sources. Are these stable core deposits or less reliable wholesale funding? Further, they examine stress test results. These tests simulate the bank's performance under adverse conditions, providing valuable insights.
Assessing Capital Return Policies
A bank's capital return policy—including dividends and share buybacks—reveals management's priorities. Returning capital to shareholders is important, but excessive payouts can weaken a bank.
Analysts must assess if current capital return policies are sustainable. Factors like projected earnings growth and potential economic headwinds must be considered.
Liquidity: The Lifeblood of Banks
Liquidity is a bank's ability to meet its obligations as they come due. This is especially vital for banks, which rely heavily on short-term funding. The Liquidity Coverage Ratio (LCR) assesses a bank's ability to cover short-term cash outflows under stress.
This ratio compares high-quality liquid assets to projected net cash outflows over a 30-day period. The Net Stable Funding Ratio (NSFR) focuses on longer-term funding stability. It compares available stable funding to required stable funding over a one-year horizon. NSFR promotes resilience by ensuring sufficient stable funding.
Recognizing Masked Weakness
Strong capital and liquidity positions can sometimes hide underlying vulnerabilities. A bank might have a high capital ratio but significant exposure to a single risky asset class.
Alternatively, it might maintain adequate liquidity normally but be vulnerable to market disruptions. Analysts must look beyond the numbers, examining the quality of assets and diversification of funding sources.
Mastering Analysis Frameworks
By understanding capital adequacy ratios, evaluating funding structures, and scrutinizing liquidity metrics, analysts can differentiate between robust and vulnerable banks. Mastering these frameworks is crucial for informed decisions and effective risk management. This allows you to confidently assess a bank’s ability to absorb losses and navigate uncertainty.
Beyond Interest Income: Uncovering Revenue Quality
While net interest income remains essential for bank profitability, modern banks increasingly depend on diverse revenue streams. Evaluating the quality, sustainability, and growth potential of this non-interest income is crucial for financial statement analysis. This analysis separates leading banks from the laggards.
Analyzing Non-Interest Income: A Deeper Dive
Non-interest income comes from various sources, including fee income, wealth management services, payment processing, and investment banking activities. Each requires a unique analytical approach to determine its true value and sustainability. For example, steady growth in wealth management fees linked to assets under management indicates a lasting competitive edge. However, a sudden jump in investment banking revenue from a single deal might not be repeatable.
Analyzing fee income demands a nuanced understanding of its origins. Are fees tied to valuable services customers willingly pay for, or are they just added charges? Sustainable fee income usually reflects a real competitive advantage and customer loyalty. You might be interested in: A Deep Dive into Bank Income: Interest vs. Non-Interest Income and Expense.
Evaluating Revenue Sustainability and Cyclicality
Not all revenue streams are equal. Some are more vulnerable to economic cycles than others. For example, investment banking revenue tends to swing dramatically with market conditions. Wealth management fees, while more stable, can still be impacted by market downturns. Evaluating the cyclicality of revenue is vital for understanding a bank's resilience in different economic climates. This involves assessing how revenue sources perform during economic expansion and contraction.
Payment processing fees, conversely, are generally less cyclical and offer a consistent income stream. This is because payment processing volumes are less tied to broader economic trends. Grasping these nuances helps pinpoint which revenue streams provide genuine long-term value. This analysis becomes even more critical given regulatory changes, such as the updated policies from the FDIC and OCC on bank mergers, which could influence competition and revenue.
Expense Trends and Efficiency Improvements
Top analysts don't just focus on revenue; they scrutinize expense trends equally. A bank may display impressive revenue growth, but rising expenses can diminish profits. Analyzing efficiency ratios, like the cost-to-income ratio, reveals how effectively a bank manages operating costs. Sustainable profitability requires a balance between revenue growth and disciplined expense management.
Additionally, evaluating strategic investments is essential. While increased technology spending might impact short-term profits, it could create long-term competitive advantages by boosting efficiency, expanding services, or attracting customers. These strategic investments, initially appearing as expenses, can be key drivers of future revenue growth.
Identifying Long-Term Revenue Opportunities
The main goal of revenue quality analysis is to identify banks with diversified and sustainable revenue engines positioned for future growth. This requires a forward-looking approach. Which banks are investing in technologies and services that will drive future income? Which banks are successfully adapting to evolving customer needs and technological changes? Analyzing management strategies, along with financial metrics, gives a more complete picture of a bank's long-term revenue potential.
Understanding these dynamics provides a more thorough assessment of a bank's financial health. Recognizing the quality and sustainability of revenue streams, along with an evaluation of expense trends and investments, helps investors and analysts identify banks with strong long-term growth prospects. This detailed analysis allows for informed decisions, going beyond surface-level examination to a more strategic assessment. This also includes considering external factors like changes to the Supplementary Leverage Ratio (SLR) and its potential impact on capital allocation and profitability. By incorporating these analyses into your financial statement review, you'll gain a more accurate understanding of a bank's true financial health and future prospects.
Valuation Mastery: What Banks Are Actually Worth

Traditional valuation methods often miss the mark when it comes to banks. Financial statement analysis for banks requires a specialized approach. This is due to their unique regulatory environment and distinct business models. This section explores the key valuation techniques used by banking specialists.
Specialized Valuation Techniques For Banks
Analyzing a bank's worth requires more than just simple price-to-earnings ratios. Unlike other industries, banks operate under a different set of rules. Here are the core methods analysts use:
Adjusted Price-to-Book Ratio: This ratio compares a bank's market price to its book value of equity. Adjustments are made for intangible assets, goodwill, and other factors. This is particularly helpful when valuing banks with significant tangible assets.
Dividend Discount Model (DDM): This model values a bank based on its projected future dividends. This approach is most effective for banks with a history of consistent dividend payouts.
Return on Tangible Equity (ROTE): This metric measures how efficiently a bank generates profit from its tangible equity. A high and sustainable ROTE often translates to premium valuations.
These methods are not mutually exclusive. Experienced analysts frequently combine these techniques to arrive at a more accurate and comprehensive valuation.
Factors Influencing Bank Valuation Multiples
Several factors influence the appropriate valuation multiples for banks. Regulatory capital constraints are a major consideration. Banks with higher capital ratios often command higher valuations due to perceived lower risk. Interest rate sensitivity also plays a role. Banks with asset-sensitive balance sheets often benefit from rising interest rates, potentially increasing their valuations.
A bank's business mix also significantly impacts its valuation. Diversified income streams, like fee income from wealth management or investment banking, can lead to higher multiples. This is because these banks are seen as less reliant on interest rate fluctuations.
Understanding Premium And Discounted Valuations
Why do some banks trade at premiums while others trade at discounts despite similar reported profits? A bank exhibiting a high ROTE and strong growth prospects might justify a premium valuation. Investors are willing to pay a premium for future earnings potential.
Conversely, a bank with deteriorating asset quality or high exposure to risky loans might trade at a discount. This reflects investor concern about potential losses and reduced profitability. Understanding these dynamics is crucial for accurate financial statement analysis. It helps identify undervalued opportunities and avoid potential value traps.
Adjusting For Credit Cycle Positioning And One-Time Items
Accurately valuing banks requires careful consideration of the credit cycle. Banks positioned conservatively heading into a downturn may trade at a premium. In contrast, banks with significant exposure to struggling sectors may be discounted.
Analysts also adjust for one-time items, such as restructuring charges, asset sales, or litigation settlements. These can distort reported earnings. Adjusting for these non-recurring events provides a clearer view of a bank's core profitability. This adjustment is critical for assessing future earnings potential.
Regulatory Changes And Fair Value Estimates
Regulatory changes can significantly impact valuations. These changes influence competition and profitability. Analysts must consider such changes when evaluating a bank's future prospects. Increased regulatory scrutiny, for example, can impact profitability and thus, valuations.
Finally, incorporating information about the Supplementary Leverage Ratio (SLR) is crucial. Changes to the SLR affect a bank's ability to allocate capital, impacting its profitability and ultimately, its valuation. For more information on the SLR, see The OFR Blog.
By understanding these specialized valuation techniques, you can identify truly undervalued banking institutions. This involves going beyond simple metrics and considering the full financial picture. This mastery of valuation helps make more informed investment decisions, avoid value traps, and maximize investment potential. It allows you to understand a bank’s true worth.
Putting It All Together: Your Bank Analysis Playbook
Transforming an understanding of individual financial statements into actionable insights requires a structured approach. This section provides a practical framework for analyzing banks, synthesizing the information from previous sections into a playbook used by professional analysts.
Building Your Analytical Framework: A Step-by-Step Guide
Financial statement analysis for banks isn’t a linear process. It’s a multi-dimensional exploration. Here's a systematic method to guide your analysis:
Macroeconomic Context: Begin by assessing the broader economic environment. Interest rate trends, inflation, and economic growth forecasts are all crucial factors influencing bank performance.
Competitive Landscape: Next, analyze the competitive environment. How does the target bank compare to its peers in terms of market share, profitability, and risk profile? Recent regulatory changes can significantly reshape the competitive dynamics.
Company-Specific Analysis: Now, dive deep into the bank's financials. Start with an overview of the balance sheet, income statement, and cash flow statement. Then, calculate and interpret key ratios, focusing on profitability, asset quality, capital adequacy, and liquidity.
Peer Group Analysis: Benchmark the bank's performance against a relevant peer group. This comparison provides essential context for interpreting metrics. Remember that different business models can justify varying performance levels.
Qualitative Factors: Don't rely solely on quantitative data. Consider qualitative factors like management credibility, strategic direction, and competitive advantages. The Management's Discussion and Analysis (MD&A) section can offer valuable insights into these qualitative aspects.
Identifying Red Flags and Opportunities
Financial statement analysis involves identifying potential red flags and hidden opportunities. Some examples include:
Deteriorating Asset Quality: A rising non-performing loan ratio coupled with inadequate loan loss reserves could signal future credit losses.
Unsustainable Revenue Growth: Rapid revenue growth driven by volatile non-interest income sources might not be sustainable.
Hidden Capital Weakness: A seemingly strong capital ratio might mask underlying vulnerabilities due to exposure to risky assets or high leverage.
Liquidity Mismatches: A bank relying heavily on short-term funding sources might be vulnerable to liquidity squeezes during market disruptions.
These red flags should trigger further investigation and detailed analysis. Conversely, identifying areas where the bank outperforms its peers might reveal hidden investment opportunities.
Developing an Investment Thesis
The ultimate goal of financial statement analysis for banks is to develop an informed investment thesis. This involves:
Synthesizing Findings: Combine your quantitative and qualitative findings to form a coherent view of the bank's financial health, risks, and opportunities.
Formulating a View: Develop a clear investment thesis articulating your view on the bank's future prospects and valuation.
Setting Price Targets: Establish realistic price targets based on your valuation analysis and expected catalysts. Consider factors like future earnings growth, regulatory changes, and overall market conditions.
Identifying Catalysts: Identify potential catalysts that could drive the bank's stock price toward your target. These could include interest rat
Latest Articles

Brian's Banking Blog
What Is Market Penetration and How Banks Can Measure It

Brian's Banking Blog
Revenue Growth Strategies: 10 Data-Driven Tactics for Banks

Brian's Banking Blog
What Is Historical Analysis? a Banker's Working Definition

Brian's Banking Blog
Customer Churn Prediction: A Practical Guide for Banks

Brian's Banking Blog
Social Network Analysis for Banking: A Practical Guide

Brian's Banking Blog