Top Financial Dashboard Software of 2025 for Smarter Insights
Brian's Banking Blog
Unlocking Financial Clarity: The Power of Dashboards
Struggling to make sense of complex financial data? This listicle presents eight leading financial dashboard software solutions to help. Discover how tools like Visbanking, Tableau, and Microsoft Power BI can transform your raw data into actionable insights. Compare top financial dashboard software options, including Qlik Sense, Looker (Google Cloud), Domo, Sisense, and Xero, to find the best fit for streamlining your reporting, improving decision-making, and identifying growth opportunities.
1. Visbanking: A Premier Financial Dashboard Software for Banking Institutions
Visbanking distinguishes itself as a leading financial dashboard software solution specifically designed for the complex needs of banking institutions. Its Bank Intelligence and Action System (BIAS) platform goes beyond basic data visualization, offering a comprehensive suite of tools that empower banks to make proactive, data-driven decisions. In a financial landscape characterized by volatile interest rates and shrinking margins, Visbanking provides a crucial competitive edge by consolidating multi-source data, including financial metrics, performance indicators, regulatory updates, and real-time news, into actionable insights. This enables banks to not just react to market changes, but to anticipate and capitalize on emerging opportunities.
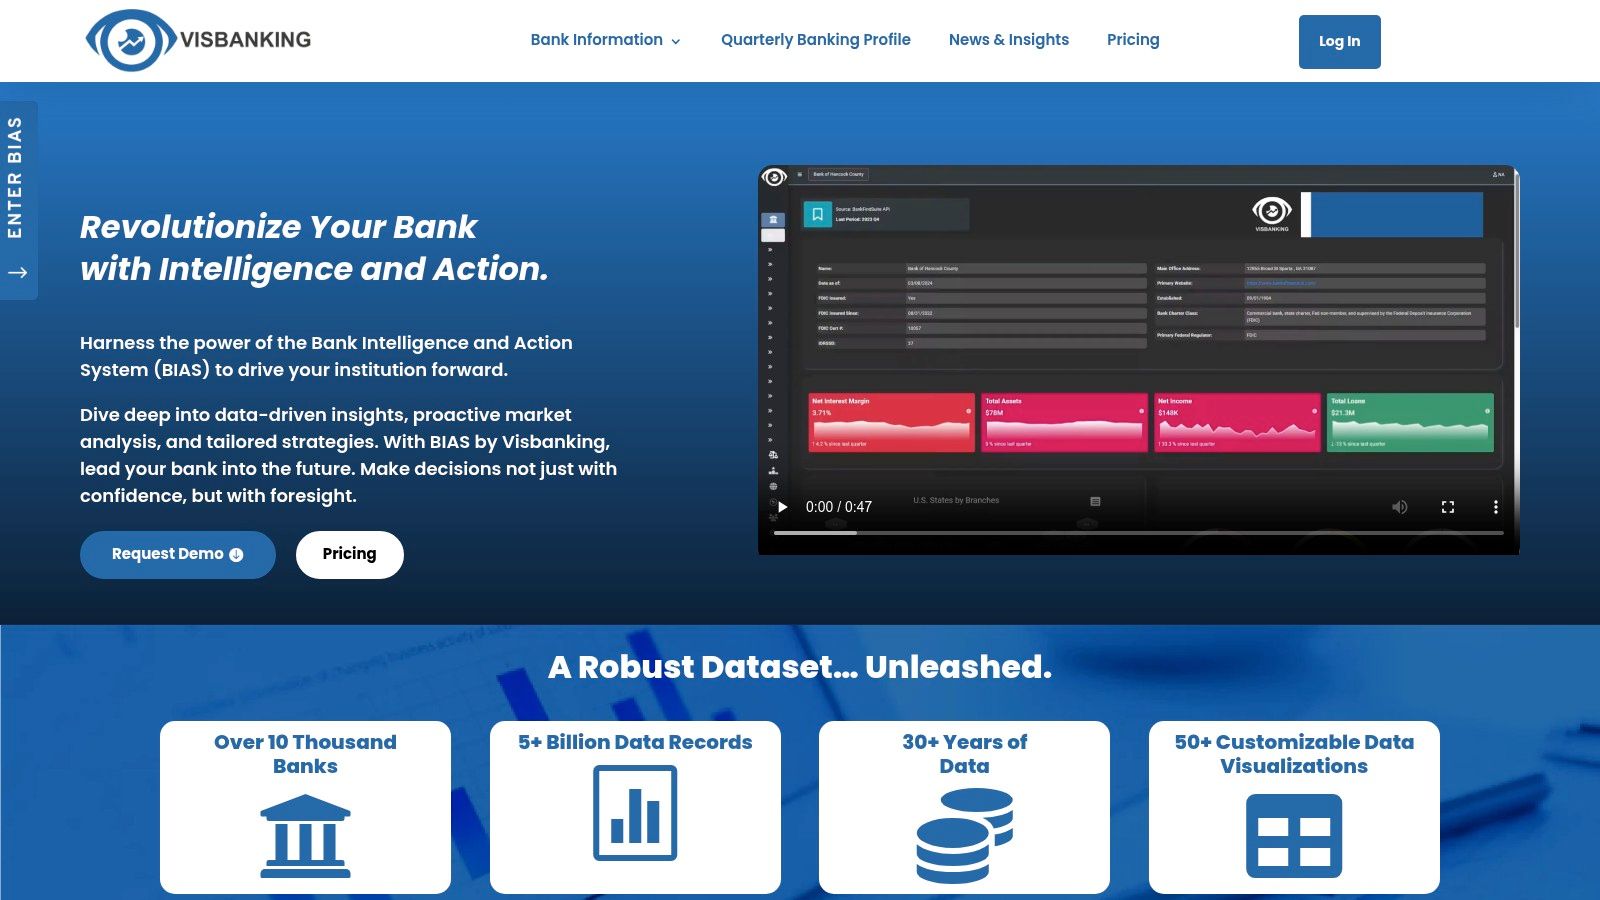
Visbanking's strength lies in its robust data foundation. With a dataset exceeding 5 billion records spanning over 30 years, BIAS provides unparalleled historical context for deep analysis and trend forecasting. Imagine being able to analyze the impact of past interest rate hikes on your loan portfolio, or to model the potential effects of upcoming regulatory changes. This historical data combined with real-time updates allows for a comprehensive understanding of the current financial environment and empowers more accurate predictions for future scenarios. Furthermore, the platform offers over 50 customizable visualizations, allowing users to tailor their dashboards to specific needs and preferences. The flexibility extends to content delivery as well, with options ranging from API integration to direct export to popular tools like Tableau, Power BI, and Excel. This ensures seamless integration with existing workflows and reporting processes.
For banking executives, Visbanking provides a high-level overview of key performance indicators, allowing for strategic oversight and informed decision-making. Financial analysts can leverage the platform's deep analytical capabilities to identify trends, assess risks, and develop data-backed investment strategies. Risk and compliance professionals benefit from real-time regulatory updates and comprehensive risk assessment tools, streamlining compliance efforts and mitigating potential threats. Innovation and IT leaders can leverage Visbanking's API to integrate financial data into other systems, creating a more connected and efficient banking ecosystem. Even banking regulators can utilize the platform to monitor industry trends and ensure financial stability.
Pros:
- Comprehensive multi-source data integration covering financials, regulatory insights, news, and performance metrics.
- Robust dataset with over 5 billion records and 30+ years of historical data for deep analysis and trend forecasting.
- More than 50 customizable visualizations and flexible content delivery (API, Tableau, Power BI, Excel).
- Enables proactive, data-driven decision-making, improving operational efficiency, transparency, and strategic agility.
- Widely trusted by over 10,000 banks and supported by consistently updated, expert banking insights.
Cons:
- Pricing details are not publicly available, requiring a demo request for tailored pricing information.
- The platform's extensive features and data complexity may necessitate training for optimal utilization.
Website: https://www.visbanking.com
While the complexity might require some initial investment in training, the long-term benefits of utilizing a comprehensive financial dashboard software like Visbanking far outweigh the initial learning curve. Its data-rich ecosystem, combined with a reputation built on widespread industry insights and positive user testimonials, positions Visbanking as a crucial tool for forward-thinking banking institutions seeking to not just survive, but thrive in today's complex financial landscape. Visbanking earns its spot on this list by offering a unique blend of depth, breadth, and flexibility tailored specifically for the banking industry. While exploring similar financial dashboard software is always recommended, the specialized focus and extensive historical data offered by Visbanking make it a particularly compelling option for banking professionals.
2. Tableau
Tableau is a leading choice for financial dashboard software, empowering organizations to transform raw financial data into interactive and insightful visualizations. It's a powerful business intelligence platform that enables finance teams to connect to diverse data sources, perform complex calculations, and visualize key financial metrics in real-time. This makes it an invaluable tool for banking executives, financial analysts, and risk professionals seeking a deeper understanding of their financial landscape. Tableau's user-friendly interface caters to both technical and non-technical users, allowing them to build sophisticated reports and dashboards without requiring extensive coding knowledge. This democratization of data access allows everyone from innovation and IT leaders to banking regulators to leverage its capabilities for better decision-making.

Tableau's strength lies in its robust visualization capabilities. Using its intuitive drag-and-drop interface, users can create dynamic dashboards that track key performance indicators (KPIs) like revenue, expenses, profitability, and cash flow. For example, a bank could use Tableau to visualize loan portfolio performance across different branches, identifying areas of strength and weakness. Risk and compliance professionals can leverage it to monitor transaction patterns and detect potential fraud. The platform's extensive data connection options, including SQL databases, Excel spreadsheets, and various cloud services, ensure that financial data from disparate sources can be seamlessly integrated into a single, cohesive view. Advanced analytics features, such as forecasting and statistical modeling, allow users to not just understand the present but also predict future trends and make proactive, data-driven decisions. Learn more about Tableau to discover how visualization can transform your understanding of financial data. This article provides valuable insights into the practical applications of visual analytics in the banking sector.
While Tableau offers a robust suite of tools, implementing a successful dashboard strategy requires planning. Begin by clearly defining your objectives and the KPIs you want to track. Ensure your data is clean and properly formatted before importing it into Tableau. Start with simple visualizations and gradually incorporate more advanced features as your team becomes more proficient. Tableau's active community and extensive learning resources provide valuable support throughout this process.
Features:
- Drag-and-drop interface for creating interactive visualizations
- Extensive data connection options (SQL databases, Excel, cloud services)
- Advanced analytics with forecasting and statistical modeling
- Mobile-responsive dashboard design
- Enterprise-grade security and governance features
Pros:
- Extremely powerful visualization capabilities
- Excellent data handling with large datasets
- Strong community support and extensive learning resources
- Regular updates with new features and improvements
Cons:
- Relatively high price point compared to competitors (pricing varies based on user type and deployment, contact Tableau for specific pricing)
- Steeper learning curve for advanced features
- Can be resource-intensive for complex dashboards (requires adequate server resources for optimal performance)
Website: https://www.tableau.com/
Tableau deserves its place on this list because it sets the standard for financial data visualization. Its power and flexibility make it a top choice for organizations looking to derive meaningful insights from their financial data, ultimately leading to better strategic decisions and enhanced performance.
3. Microsoft Power BI
Microsoft Power BI is a leading financial dashboard software solution that empowers organizations to transform raw data into actionable insights. It provides interactive visualizations and business intelligence capabilities with an interface simple enough for end users, including financial analysts and banking executives, to create their own reports and dashboards. For financial teams, Power BI offers robust financial modeling, reporting, and dashboard creation tools that integrate seamlessly with other Microsoft products like Excel and Dynamics 365. Its cloud-based service allows for easy sharing and collaboration on financial reports across organizations, fostering improved communication and decision-making among banking executives, risk and compliance professionals, and IT leaders.
Power BI earns its spot on this list due to its versatility and integration capabilities. Imagine effortlessly pulling data from various sources, including Excel spreadsheets, SQL databases, and even cloud-based platforms like Azure. Power BI simplifies this process, allowing financial analysts to consolidate information and create comprehensive dashboards that track key performance indicators (KPIs) like revenue, expenses, and profitability. Learn more about Microsoft Power BI for practical examples and use cases tailored for the financial sector. This includes examples relevant to banking regulators needing to oversee financial stability.
For banking executives, Power BI dashboards can provide a real-time overview of the organization's financial health, enabling quick identification of trends and potential risks. Risk and compliance professionals can leverage Power BI to monitor regulatory compliance, identify potential fraud, and manage risk exposures. Innovation and IT leaders can benefit from the platform's custom visual development options and powerful DAX formula language to create tailored solutions for specific financial needs. Its AI-powered insights and natural language query capabilities further enhance its usability, allowing even non-technical users to explore data and generate insights easily.
Key Features:
- Native integration with Microsoft ecosystem: Seamlessly connects with Excel, Dynamics 365, Azure, and other Microsoft products.
- AI-powered insights: Leverages machine learning to uncover hidden trends and provide predictive analytics.
- Custom visual development: Offers extensive options for creating bespoke visualizations.
- Powerful DAX formula language: Facilitates complex financial calculations and data analysis.
- Incremental data refresh: Efficiently updates large financial datasets without requiring full refreshes.
Pros:
- Cost-effective: Offers competitive pricing compared to other enterprise BI solutions.
- Strong Microsoft integration: Streamlines workflows for organizations already utilizing the Microsoft ecosystem.
- Regular updates: Benefits from continuous improvements and new features through monthly updates.
- Robust data governance and security: Ensures data integrity and compliance with regulatory requirements.
Cons:
- Premium features require licensing: Some advanced features, like AI-powered insights and paginated reports, require a Power BI Premium license.
- Data modeling complexity: The data modeling aspect can be challenging for users without prior experience.
- Scalability limitations: While capable of handling large datasets, Power BI may not be as performant as specialized tools for extremely large and complex data environments.
Pricing: Power BI offers various licensing options, including a free desktop version, Power BI Pro, and Power BI Premium. Premium pricing is based on capacity and is suitable for enterprise-level deployments with demanding requirements.
Technical Requirements: Power BI Desktop is a free application that can be installed on Windows operating systems. The Power BI service is cloud-based and accessible through a web browser. For mobile access, Power BI mobile apps are available for iOS, Android, and Windows devices.
4. Qlik Sense: Uncovering Hidden Insights in Financial Data
Qlik Sense stands out as a robust financial dashboard software solution, offering a comprehensive data analytics platform built on a unique associative analytics engine. This allows users to explore the complex relationships between data points from disparate sources, revealing hidden connections that traditional query-based systems often miss. For financial professionals, this means a deeper understanding of underlying trends and drivers within their data, leading to more informed decisions and strategic advantages. Qlik Sense empowers users to move beyond static reports and predefined queries, enabling interactive exploration and discovery that fosters a more proactive and dynamic approach to financial analysis. This makes it a compelling choice for organizations looking to harness the full potential of their financial data.
For banking executives, Qlik Sense can provide a holistic view of performance across the entire organization, identifying areas of strength and weakness, and facilitating data-driven strategic planning. Financial analysts can leverage the platform's powerful visualization capabilities and self-service features to build custom dashboards that track key performance indicators (KPIs) and provide real-time insights into market trends. Risk and compliance professionals benefit from the robust data governance and lineage tracking, enabling them to trace the origin of data and ensure compliance with regulatory requirements. Innovation and IT leaders can leverage Qlik Sense's multi-cloud architecture and flexible deployment options to seamlessly integrate the platform into existing systems. Banking regulators can use Qlik Sense to analyze financial data from multiple institutions, identify systemic risks, and ensure the stability of the financial system.
Qlik Sense's associative engine is its core differentiator, automatically maintaining the relationships within all loaded data. This allows users to explore connections across different datasets without needing complex joins or pre-defined queries. The platform's self-service capabilities allow finance professionals, even those without extensive technical expertise, to create interactive visualizations and tailor dashboards to their specific needs. Augmented intelligence features, powered by the Qlik Cognitive Engine, further enhance the analytical capabilities, providing intelligent insights and predictions based on the data.
Features:
- Associative engine: Maintains relationships in all data, enabling dynamic exploration.
- Self-service visualization: Empowers users to create custom dashboards with ease.
- Augmented intelligence: Leverages AI to uncover hidden insights and make predictions.
- Multi-cloud architecture: Offers flexible deployment options for seamless integration.
- Advanced data preparation and integration: Simplifies data management and ensures data quality.
Pros:
- Unique associative data model reveals hidden insights: Uncovers connections missed by traditional BI tools.
- Strong data governance and lineage tracking: Ensures data accuracy and regulatory compliance.
- Highly interactive dashboards with responsive design: Provides a seamless user experience across devices.
- Excellent performance with large datasets: Handles complex financial data with speed and efficiency.
Cons:
- Steeper learning curve than some competitors: Requires some investment in training.
- Higher price point for enterprise features: May not be suitable for smaller organizations with limited budgets.
- Custom visualizations require technical expertise: While self-service is available, complex visualizations may require developer skills.
While pricing information isn't publicly available, Qlik Sense offers different licensing tiers to accommodate various needs and budgets. Technical requirements vary depending on the chosen deployment option (cloud or on-premise). Implementation generally involves data integration, application development, and user training. Compared to tools like Tableau or Power BI, Qlik Sense differentiates itself with its associative engine and its focus on revealing hidden relationships within data.
Website: https://www.qlik.com/us/products/qlik-sense
5. Looker (Google Cloud)
Looker, now a part of Google Cloud, stands out as a robust choice among financial dashboard software solutions. It empowers organizations to transform raw data into actionable financial insights, fostering data-driven decision-making across various levels. This business intelligence and big data analytics platform is particularly well-suited for financial analytics due to its powerful features and flexible data modeling capabilities. It earns its place on this list by offering a robust, albeit more technical, approach to building a single source of truth for financial data.
For banking executives, financial analysts, risk and compliance professionals, innovation and IT leaders, and even banking regulators, Looker offers a centralized platform to explore, analyze, and share real-time business analytics. This is crucial for maintaining regulatory compliance, identifying emerging trends, and managing risk effectively.
Key Features and Benefits for Financial Professionals:
- LookML Data Modeling Language: Looker's proprietary LookML modeling language is a game-changer for finance teams. It allows analysts to define complex financial calculations, metrics (like key performance indicators - KPIs), and relationships between data points in a centralized, reusable way. This eliminates the inconsistencies that often arise from using disparate spreadsheets and reporting tools, ensuring everyone works from the same data foundation. Imagine defining a complex calculation for "Net Interest Margin" once in LookML and then having it consistently applied across all reports and dashboards – that's the power of LookML. This is particularly beneficial for ensuring compliance with regulatory reporting requirements.
- Version Control and Git Integration: Financial models built in LookML are treated as code, meaning they can be version controlled using Git. This offers significant advantages for auditability, collaboration, and change management, vital for regulated industries like banking.
- Embedded Analytics: Looker can be seamlessly integrated into existing financial applications, providing real-time insights directly within the tools users already rely on. This streamlines workflows and reduces the need to switch between different platforms.
- Scheduled Data Delivery and Alerts: Automate the delivery of key financial reports and receive alerts on critical KPIs. This allows for proactive monitoring of financial performance and identification of potential issues. For example, a risk manager could set up alerts for unusual transaction patterns or deviations from budget targets.
- Granular Access Controls and Row-Level Security: Looker offers robust security features, allowing administrators to define granular access permissions down to the row level. This ensures that sensitive financial data is only accessible to authorized personnel, crucial for maintaining compliance and data integrity.
Pros:
- Centralized Data Modeling: LookML ensures consistent financial metrics across the organization, minimizing errors and discrepancies.
- SQL-Friendly: Looker's SQL-based approach is familiar to many financial analysts, easing the learning curve.
- Single Source of Truth: Looker excels at creating a single, reliable source of financial data, eliminating data silos and improving decision-making.
- Google Cloud Integration: Seamless integration with other Google Cloud Platform services offers a powerful and scalable analytics ecosystem.
Cons:
- Technical Expertise Required: Setting up and maintaining Looker requires technical expertise in SQL and LookML. While this empowers analysts with greater control and flexibility, it also means there's a steeper learning curve compared to some drag-and-drop tools.
- Higher Price Point: Looker is a premium solution with a higher price point than some other financial dashboard software options. Pricing is typically based on usage and requires contacting Google Cloud for a quote.
- Limited Visualization Customization: While Looker provides robust visualization options, the level of customization may be less extensive than specialized visualization tools.
Implementation and Setup Tips:
- Invest in LookML Training: Ensure your team receives adequate training on LookML to fully leverage its capabilities.
- Start with a Pilot Project: Begin with a smaller pilot project to test and refine your Looker implementation before scaling it across the organization.
- Leverage Google Cloud Resources: Utilize the extensive documentation and support resources available through Google Cloud.
Comparison with Similar Tools:
Compared to tools like Tableau or Power BI, Looker prioritizes a more code-driven approach to data modeling. While Tableau and Power BI excel in visual exploration and drag-and-drop functionality, Looker's LookML provides greater control and consistency for complex financial calculations. This makes Looker particularly suitable for organizations that require a highly governed and scalable analytics solution, even if it necessitates more upfront technical investment.
Website: https://looker.com/
Looker’s robust data modeling, centralized approach, and tight integration with the Google Cloud ecosystem make it a compelling choice for organizations seeking a sophisticated financial dashboard software solution. Though it requires a greater technical investment, the benefits of data consistency, scalability, and advanced analytics capabilities make it a valuable tool for data-driven financial management.
6. Domo
Domo is a cloud-based business intelligence platform designed to connect data, systems, and people, transforming how organizations manage their business. Specifically for financial dashboards, Domo offers a comprehensive solution encompassing data integration, preparation, visualization, and collaboration, all within a single platform. Its strength lies in connecting to virtually any data source, providing real-time financial insights, and offering alerting capabilities for critical financial metrics. This makes it an ideal choice for banking executives, financial analysts, and risk and compliance professionals seeking a powerful yet user-friendly financial dashboard software solution.
For banking executives specifically, Domo's mobile-first design allows for on-the-go monitoring of key financial indicators. Imagine being able to instantly access real-time data on loan performance, deposit growth, or net interest margin directly from your mobile device. Domo makes this a reality. For financial analysts, Domo's "Beast Mode" calculations enable the creation of custom financial metrics and KPIs, providing the flexibility to analyze data in ways tailored to specific business needs. Risk and compliance professionals can leverage Domo's real-time alerts to identify and address potential issues proactively. For example, alerts can be set up for unusual transaction activity, regulatory breaches, or significant changes in key risk indicators. Innovation and IT leaders appreciate Domo's extensive pre-built connectors and the ability to integrate with existing banking systems.
Domo boasts over 1,000 pre-built connectors for diverse financial data sources, facilitating seamless integration with core banking systems, CRM platforms, and other relevant data repositories. Real-time data processing allows for immediate identification of trends and anomalies, while customizable alerts ensure that critical financial KPIs remain within acceptable thresholds. The collaboration features, including commenting and sharing functionalities, foster communication and data-driven decision-making among teams. If you’re a bank CFO looking to implement a robust BI system, you might find this article helpful: Learn more about Domo.
Features:
- Over 1,000 pre-built connectors for financial data sources
- Real-time data processing and alerts for financial KPIs
- Beast Mode calculations for custom financial metrics
- Collaboration tools with commenting and sharing functionality
- Mobile-first design for on-the-go financial monitoring
Pros:
- Exceptionally user-friendly interface
- Comprehensive platform covering the entire BI workflow
- Strong mobile experience for executive financial dashboards
- Excellent data connectivity options
Cons:
- Can be expensive for larger implementations
- Some advanced customizations may require professional services
- Data governance features may be less robust than some enterprise-focused alternatives
While Domo's pricing isn't publicly available, it's generally understood that larger implementations can be costly. Furthermore, achieving advanced customizations might necessitate engaging Domo's professional services team. Finally, while Domo offers data governance features, they might not be as comprehensive as those found in platforms specifically designed for enterprise-level data governance.
Implementation tips include starting with a clearly defined scope and objectives, identifying key data sources and KPIs, and leveraging Domo's extensive training resources and support community.
Despite the potential cost considerations, Domo's comprehensive features, user-friendly interface, and powerful mobile capabilities make it a strong contender in the financial dashboard software landscape, particularly for banking and financial institutions seeking real-time insights and enhanced collaboration. Visit the Domo website for more information.
7. Sisense
Sisense is a robust AI-driven analytics platform designed to empower financial teams to prepare, analyze, and visualize complex financial data with speed and efficiency. This financial dashboard software stands out for its innovative In-Chip™ technology, which allows for the rapid processing of massive financial datasets, and its impressive ability to seamlessly integrate data from disparate sources, eliminating the need for a dedicated data warehouse. This is particularly beneficial for financial institutions dealing with high volumes of transactional data, market feeds, and customer information. For building financial dashboards, Sisense offers a user-friendly, code-free interface that enables business users to create interactive visualizations and reports. At the same time, it provides the flexibility for more technical users, such as data analysts and IT professionals, to leverage JavaScript and Python for advanced customization and scripting. This makes Sisense a suitable solution for organizations looking to bridge the gap between business users and technical experts.

For banking executives, Sisense can provide a comprehensive view of key performance indicators (KPIs) such as profitability, loan performance, and customer churn. Financial analysts can leverage the platform's advanced analytics capabilities to perform in-depth analysis of financial data, identify trends, and generate insightful reports. Risk and compliance professionals can use Sisense to monitor regulatory compliance, detect fraudulent activities, and manage risk effectively. Innovation and IT leaders will appreciate the platform's scalability, flexibility, and powerful API for integrating with existing systems. Even banking regulators can utilize Sisense to analyze industry data and monitor the financial health of institutions.
Key Features and Benefits:
- In-Chip™ Technology: This proprietary technology significantly accelerates data processing speeds, enabling real-time analysis of large financial datasets.
- ElastiCube Data Management: This unique feature simplifies the process of combining data from various financial sources without requiring a separate data warehouse. This reduces the time and resources needed for data preparation and integration.
- AI-Powered Insights and Anomaly Detection: Sisense leverages AI and machine learning to identify patterns, anomalies, and potential risks within financial data, providing valuable insights for proactive decision-making.
- White-labeled Embedded Analytics:
Latest Articles

Brian's Banking Blog
Credit Bureau Data: Strategic Insights for Bank Executives

Brian's Banking Blog
Fraud Detection in Banking Guide for Executives

Brian's Banking Blog
How to Identify Growth Opportunities in Banking Sales

Brian's Banking Blog
Bank Email Signature Examples: Executive Templates 2026

Brian's Banking Blog
International Management Internships: A Bank's Playbook

Brian's Banking Blog