Top 5 Examples of Data Analysis Reports for Banking Leaders
Brian's Banking Blog
In banking, the distance between data and a decision is a direct measure of competitive advantage. While dashboards provide a retrospective view, true leadership requires forward-looking intelligence derived from rigorous analysis. This is not about creating more charts; it is about making fewer, better decisions that directly impact the bottom line. Effective data analysis reports are the critical bridge from raw information to strategic action, helping to identify untapped markets, predict credit risk with greater accuracy, and optimize capital allocation for maximum return.
For bank executives and directors, mastering this discipline is no longer optional. The ability to move beyond surface-level metrics is what separates market leaders from the competition. To effectively turn data into decisive action, one must possess the ability to interpret various data visualizations. This includes understanding how to read and interpret charts, a fundamental skill across all analytical domains. A well-structured report does not just present findings; it delivers a clear, evidence-based narrative that compels action and drives strategic outcomes.
This article presents several critical examples of data analysis reports, reframed specifically for the banking sector. We will break down each one to demonstrate how to transform complex datasets into a clear strategic asset, providing actionable takeaways that your institution can implement to improve performance and secure a competitive edge.
1. Branch and Product Performance Analysis (Sales Performance Reimagined)
Traditional sales reports often focus on loan volume, a metric that provides a limited view of true profitability. A modern branch and product performance analysis, however, offers a multidimensional view of your institution's health by integrating disparate data sources. This type of report is one of the most powerful examples of data analysis reports because it moves beyond surface-level metrics to uncover the real drivers of financial performance.
Strategic Breakdown
This analysis dissects profitability by examining net interest margin (NIM) per product, fee income contributions from each branch, and the cost of customer acquisition across different segments. For instance, a report might reveal that your downtown branch originates high-volume mortgages, but its NIM is 25 basis points lower than a suburban branch focused on high-yield commercial loans. Another insight could be that a specific checking product, while low in volume, generates substantial non-interest income from overdraft fees.
Key Tactic: Correlate loan officer performance not just with origination volume but with the risk-adjusted return on capital (RAROC) and NIM of the loans they produce. This aligns incentives directly with bank-wide profitability goals.
Actionable Takeaways
- Reallocate Capital: Shift marketing budgets and personnel from low-NIM products to those demonstrating higher profitability, even if their volumes are lower.
- Optimize Product Mix: Identify and promote high-performing products within underperforming branches to lift overall branch profitability.
- Refine Incentive Structures: Design compensation plans that reward loan officers for generating profitable relationships, not just closing deals.
By leveraging integrated data intelligence, executives can transition from making decisions based on volume to making strategic choices based on true profitability, a critical shift in today's competitive landscape.
2. Customer Behavior Analytics Report (Mapping the Customer Journey)
Generic customer profiles are no longer sufficient. A modern customer behavior analytics report synthesizes data from every touchpoint, from mobile app logins to in-branch visits and call center interactions. It transforms raw behavioral data into a coherent narrative of the customer journey. This approach is one of the most vital examples of data analysis reports as it allows institutions to move from reactive service to proactive, personalized engagement.

Strategic Breakdown
This analysis identifies distinct customer segments based on their actual behaviors, not just demographics. It tracks product adoption sequences, channel preferences, and signs of potential churn, like a decrease in direct deposit frequency or a drop in digital banking logins. For example, a report could reveal that 70% of new mortgage holders who also open a HELOC within 90 days have a 50% higher lifetime value. Another insight might be that customers who use Zelle more than five times a month are 80% less likely to attrite.
Key Tactic: Use path analysis to map the most common customer journeys that lead to high-value product adoption or, conversely, to account closure. Identify the critical decision points and optimize interventions at those moments.
Actionable Takeaways
- Predict and Prevent Churn: Proactively engage at-risk customers identified through behavioral triggers with targeted retention offers before they leave.
- Personalize Cross-Selling: Target customers with product offers that align with their observed financial behaviors, such as offering investment services to those making large, regular transfers.
- Enhance Digital Experience: Prioritize UX/UI improvements on the app features most used by your highest-value customer segments to deepen engagement.
By leveraging behavioral analytics, executives can architect a customer experience that feels intuitive and personalized, directly boosting loyalty and profitability in a crowded market.
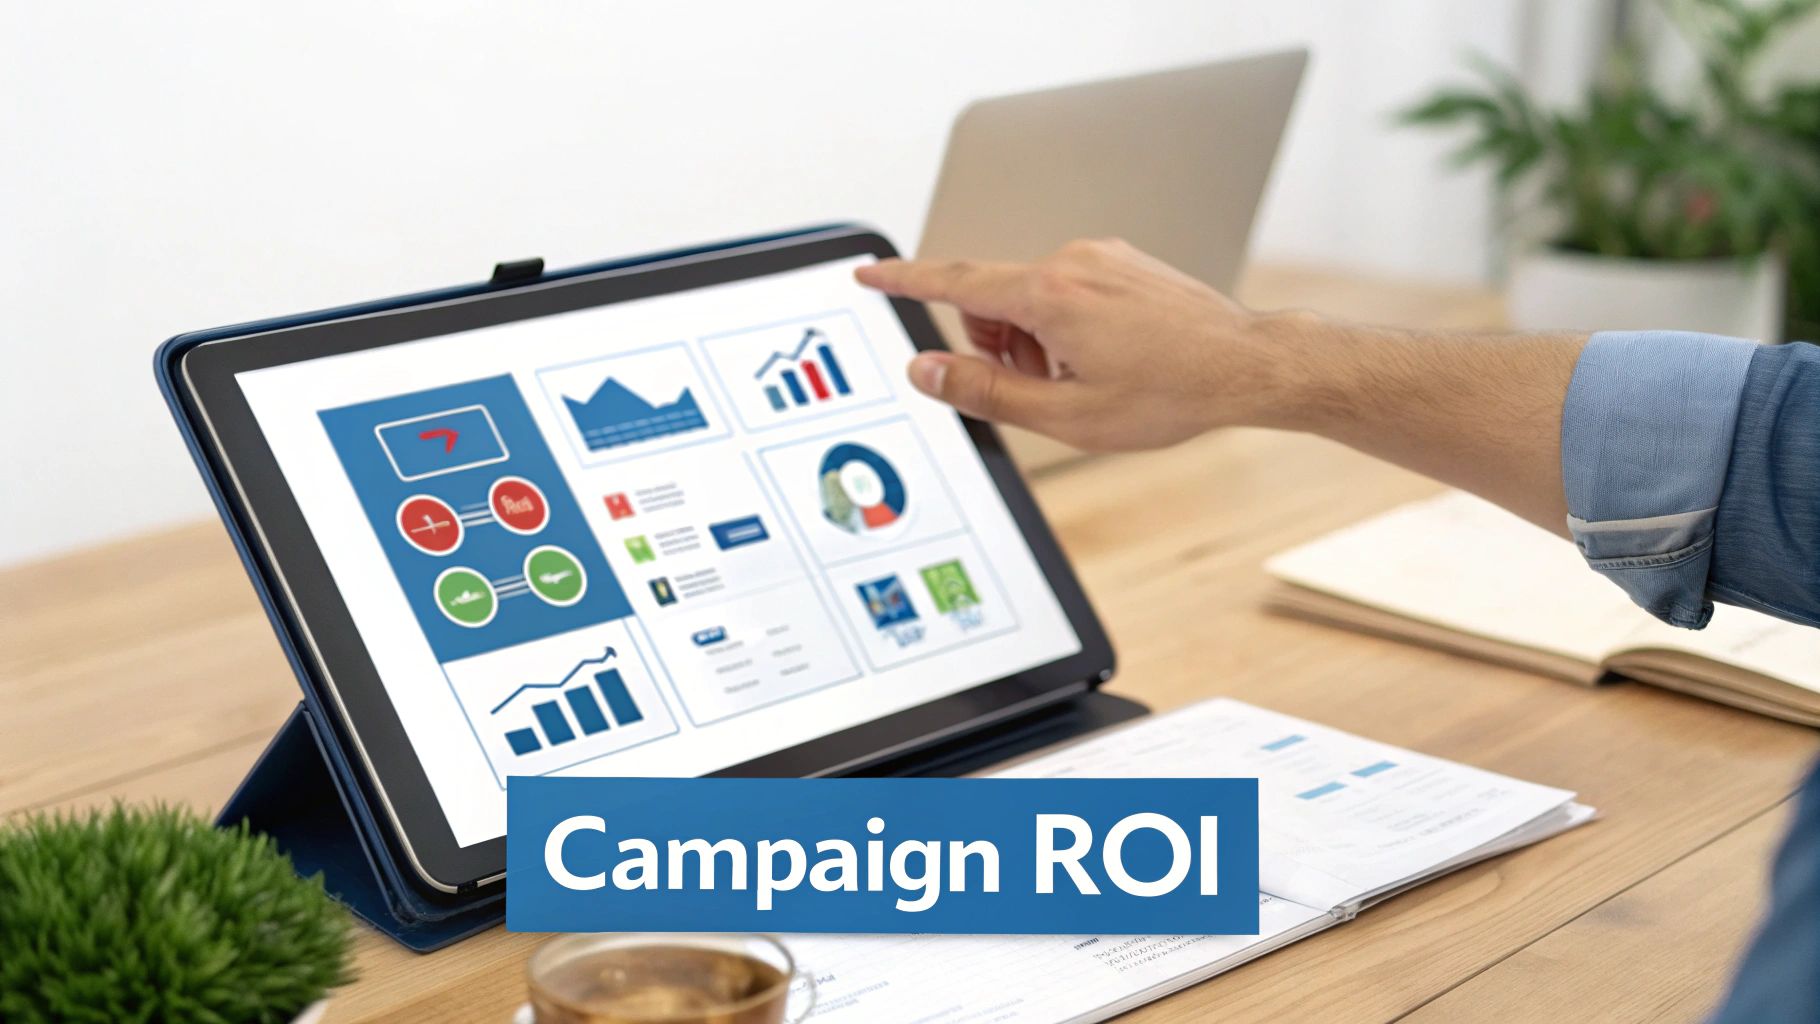
3. Marketing Campaign Performance Report
Standard marketing reports often get bogged down in vanity metrics like clicks and impressions, failing to connect campaign activity to the bottom line. A comprehensive marketing campaign performance report, however, synthesizes data across multiple channels to measure true return on investment (ROI) and its impact on customer lifetime value. This analysis is one of the most vital examples of data analysis reports as it directly translates marketing spend into measurable financial outcomes.
Strategic Breakdown
This report moves beyond simple conversion rates to analyze the entire customer journey, from first touchpoint to final sale and beyond. It connects data from Google Ads, social media platforms, and email marketing systems to core banking data. For instance, the analysis might reveal that a LinkedIn campaign targeting small business owners has a high cost per click but generates commercial loan applications with an average value of $250,000, delivering a 10x ROI. In contrast, a lower-cost Facebook campaign might drive many new checking accounts that remain unprofitable for the first 12 months.
Key Tactic: Implement a multi-touch attribution model that assigns proportional credit to each marketing touchpoint in the conversion path. This prevents overvaluing the final click and provides a more accurate view of how different channels work together to acquire profitable customers.
Actionable Takeaways
- Optimize Channel Spend: Reallocate marketing dollars from channels with a high cost-per-acquisition and low customer lifetime value to those proven to attract high-value, long-term relationships.
- Refine Audience Targeting: Use insights from high-performing campaigns to build more precise lookalike audiences and sharpen targeting parameters for future initiatives.
- Enhance Campaign Messaging: A/B test ad copy, landing pages, and calls-to-action based on which creative elements resonate most with segments that convert into profitable customers.
By linking marketing efforts directly to financial performance, executives can ensure their advertising budget is an investment in growth, not just an expense, fostering a data-driven culture of accountability.
4. Financial Data Analysis Report (Beyond the Balance Sheet)
A standard financial report presents historical data, but a modern financial data analysis report transforms this information into a forward-looking strategic tool. This report is a cornerstone among examples of data analysis reports because it moves beyond mere compliance to interpret trends, assess financial health, and model future scenarios. It integrates data from accounting systems, market benchmarks, and operational platforms to provide a holistic view of the institution's fiscal resilience and opportunities.
Strategic Breakdown
This analysis goes deeper than quarterly earnings by dissecting budget variance, cash flow dynamics, and key financial ratios over time. For instance, a report might show that while overall revenue is up 5%, a budget variance analysis reveals that the marketing department's customer acquisition cost (CAC) has increased by 20%, significantly eroding profit margins. Another insight could come from a cash flow analysis that projects a potential liquidity shortfall in six months, prompting proactive capital management, a process streamlined by strong financial data integration.
Key Tactic: Implement scenario planning and stress testing within the report. Model the impact of a 50-basis-point interest rate hike or a 10% downturn in the local real estate market on your capital adequacy and profitability.
Actionable Takeaways
- Optimize Capital Allocation: Use budget variance insights to reallocate funds from underperforming initiatives to high-ROI activities.
- Proactively Manage Liquidity: Leverage cash flow projections to adjust investment strategies or secure credit lines well before a liquidity crunch occurs.
- Strengthen Investor Confidence: Present detailed, forward-looking financial analyses that demonstrate robust risk management and strategic foresight to regulators and stakeholders.
By transforming static financial statements into dynamic analytical reports, executives can make data-driven decisions that safeguard the institution's financial health and drive sustainable growth.
5. Website Analytics and User Experience Report
Beyond just tracking visitors, a modern Website Analytics and User Experience (UX) Report provides a granular view of how customers and prospects interact with your digital branch. This analysis moves beyond vanity metrics like page views to dissect user behavior, conversion funnels, and engagement patterns. It stands as one of the most critical examples of data analysis reports for any financial institution aiming to optimize its digital channels for lead generation, customer support, and product applications.

Strategic Breakdown
This report dissects the entire digital customer journey, from initial traffic source to final conversion. For example, an analysis might reveal that while your Google Ads campaign drives high traffic to a mortgage landing page, 85% of users abandon the application form on the second step. Heatmap analysis could show that a critical "Next" button is below the fold on mobile devices, creating a friction point. By segmenting data, you can see how different devices and traffic sources influence user flow and conversion rates, providing a clear roadmap for optimization. Following data visualization best practices is key to making these complex user flows understandable.
Key Tactic: Implement systematic A/B testing on key conversion pages. Test variations in headlines, call-to-action buttons, and form layouts to identify changes that measurably increase application completion rates, even by a few percentage points.
Actionable Takeaways
- Optimize Conversion Funnels: Use user flow and heatmap data to identify and remove specific friction points in your online account opening or loan application processes.
- Refine Digital Marketing Spend: Reallocate marketing budget toward channels (e.g., organic search, specific social media platforms) that deliver not just traffic, but highly engaged users who convert.
- Enhance User Experience: Prioritize website updates and redesigns based on quantitative data showing where users struggle or drop off, ensuring development resources are spent effectively.
By translating clicks, scrolls, and session times into strategic insights, banks can transform their website from a simple digital brochure into a high-performing engine for customer acquisition and retention.
6. Human Resources and Employee Analytics Report
Forward-thinking institutions understand that their greatest asset is their people, not just their balance sheet. A human resources and employee analytics report transforms workforce management from an administrative function into a strategic driver of growth. This analysis synthesizes data on recruitment, retention, performance, and compensation to provide a clear picture of workforce health, making it one of the most vital examples of data analysis reports for long-term success.
Strategic Breakdown
This report goes beyond simple headcount and turnover rates. It dissects metrics like cost-per-hire by role, time-to-productivity for new loan officers, and the correlation between employee engagement scores and branch-level profitability. For instance, an analysis might reveal that a 10% increase in employee engagement survey scores at a specific branch correlates with a 4% increase in new account openings. It can also identify departments with high-performer attrition, pinpointing systemic issues before they impact the bottom line.
Key Tactic: Correlate employee performance data with compensation benchmarks. Identify if top-quartile performers are being compensated competitively relative to the market, which can preemptively address retention risks before they materialize.
Actionable Takeaways
- Optimize Recruitment Spending: Allocate recruiting resources toward channels that consistently produce high-performing, long-tenured employees, reducing acquisition costs.
- Improve Talent Retention: Use engagement and performance data to create targeted professional development programs for high-potential staff, improving morale and reducing turnover.
- Enhance Compensation Strategy: Benchmark salaries and bonuses against performance metrics and industry standards to ensure compensation is both competitive and merit-based.
By transforming HR data into strategic intelligence, executives can build a more productive, engaged, and profitable workforce, directly linking talent management to financial outcomes.
7. Supply Chain and Inventory Analytics Report
A modern supply chain and inventory analytics report moves beyond simple stock counts and shipping logs. It integrates data from procurement, logistics, warehousing, and sales forecasting to create a holistic view of operational efficiency. This analysis is one of the most vital examples of data analysis reports for institutions managing physical assets, such as marketing materials or branch supplies, as it directly impacts operational costs and service delivery.
Strategic Breakdown
This analysis dissects the entire supply chain, examining metrics like inventory turnover, carrying costs, supplier lead times, and order accuracy. For a bank, this could mean analyzing the supply chain for new debit cards, checkbooks, or promotional materials for a marketing campaign. For instance, a report might reveal that while one vendor offers a 10% lower unit price on branded materials, their inconsistent delivery times lead to a 15% higher rate of stockouts at key branches, ultimately increasing rush-shipping costs that negate the initial savings.
Key Tactic: Implement demand sensing by correlating marketing campaign schedules and new account opening trends with the required inventory levels of physical supplies. This prevents both costly overstocking and disruptive shortages during peak demand periods.
Actionable Takeaways
- Optimize Supplier Mix: Use performance data to renegotiate contracts or shift business from underperforming suppliers to those who consistently meet delivery and quality key performance indicators (KPIs).
- Refine Inventory Strategy: Implement a just-in-time (JIT) inventory model for non-critical supplies to reduce carrying costs, while maintaining a safety stock for essential items like debit card chips.
- Improve Demand Forecasting: Leverage predictive analytics to forecast the need for branch supplies based on seasonal customer traffic and planned product launches, ensuring materials are available when needed.
By transforming supply chain data into actionable intelligence, institutions can streamline operations, reduce waste, and ensure that both employees and customers have the physical resources they need without fail.
8. Product Analytics and Usage Report (Optimizing Digital Engagement)
Standard digital banking reports often track logins and transaction counts, but these metrics fail to capture how customers actually engage with your digital products. A product analytics and usage report provides a granular view of user behavior, tracking feature adoption, user journeys, and drop-off points. This analysis is one of the most vital examples of data analysis reports for any bank serious about winning in the digital arena, as it provides the roadmap for product improvement and customer retention.
Strategic Breakdown
This report moves beyond simple activity logs to analyze feature funnels, cohort retention, and session duration for specific tools like mobile check deposit or P2P payments. For example, an analysis might show that while 70% of new mobile app users enable biometric login, only 15% proceed to set up bill pay in their first week. It could also reveal that business clients who use the bulk ACH upload feature have a 40% higher retention rate than those who only use basic account services, directly linking feature usage to long-term value.
Key Tactic: Implement event-based tracking to map user flows. This allows you to identify precise points of friction, such as where users abandon the process of adding an external account, and A/B test solutions to improve completion rates.
Actionable Takeaways
- Refine the Product Roadmap: Prioritize enhancements for high-engagement features and address usability issues in features with high drop-off rates to maximize development ROI.
- Improve User Onboarding: Create targeted in-app tutorials or email campaigns for users who haven't adopted key "sticky" features within their first 30 days.
- Segment for Proactive Outreach: Identify power users for feedback and potential upselling, while flagging low-engagement customers for proactive outreach to prevent churn.
By understanding precisely how customers interact with digital offerings, banks can make data-driven decisions that enhance user experience, deepen relationships, and build a more profitable digital ecosystem.
9. Healthcare and Medical Data Analysis Report (Evidence-Based Operations)
While not a direct financial instrument, the healthcare data analysis report offers a powerful template for any highly regulated industry, including banking. It translates complex operational and clinical data into actionable strategies for improving outcomes and efficiency. This type of analysis is one of the most compelling examples of data analysis reports because it demonstrates how to balance quality, cost, and compliance in a high-stakes environment.
Strategic Breakdown
This analysis synthesizes disparate data points—from patient admission rates and treatment efficacy to operating room utilization and supply chain costs. For example, a report might reveal that a specific surgical procedure has a 15% higher readmission rate when performed by a certain cohort of physicians, pinpointing a need for targeted training. Another insight could be that a 10% increase in nurse-to-patient ratios in the ICU correlates with a 5% reduction in average length of stay, directly impacting costs and capacity.
Key Tactic: Implement risk-adjusted metrics to create fair comparisons. When evaluating performance, whether for a clinical procedure or a loan portfolio, adjusting for the inherent risk of the patient or customer population prevents misinterpretation and ensures resources are allocated equitably.
Actionable Takeaways
- Optimize Resource Allocation: Use utilization data to adjust staffing schedules, operating room availability, and equipment purchasing to match actual demand, reducing waste.
- Improve Quality and Compliance: Identify patterns in adverse events or patient outcomes to refine clinical protocols and ensure adherence to regulatory standards, a direct parallel to banking compliance.
- Enhance Operational Efficiency: Analyze patient flow and administrative bottlenecks to streamline processes, similar to how a bank would optimize its loan application and approval workflow.
By applying an evidence-based approach to operations, healthcare organizations make smarter, safer, and more cost-effective decisions, a model that financial institutions can adapt to drive their own operational excellence.
10. Social Media and Content Analytics Report
Beyond vanity metrics like follower counts, a modern social media and content analytics report provides a granular view of brand perception, customer sentiment, and competitive positioning. This analysis connects social media activity directly to business outcomes, such as brand equity and lead generation. By dissecting engagement and sentiment, this report stands out as one of the most insightful examples of data analysis reports for gauging public opinion and its impact on your institution's reputation.
Strategic Breakdown
This report moves past simple engagement rates to perform sentiment analysis on customer comments and mentions, identifying recurring themes related to products like mortgage applications or new digital banking features. For example, a report could reveal that while a new mobile deposit campaign generated a 15% lift in engagement, natural language processing (NLP) analysis shows that 40% of the associated comments express frustration with the user interface. This turns a seemingly positive metric into a critical product feedback tool.
Key Tactic: Benchmark your share of voice and sentiment scores against key competitors. If a rival bank sees a 25% spike in negative sentiment following a fee change, your marketing team has a clear, data-backed opportunity to launch a targeted campaign highlighting your lower-fee structure.
Actionable Takeaways
- Refine Content Strategy: Prioritize content formats (e.g., video tutorials, client success stories) that correlate with the highest positive sentiment and engagement, not just views.
- Inform Product Development: Channel insights from sentiment analysis directly to product teams to address common pain points and improve customer experience.
- Proactive Reputation Management: Use real-time sentiment tracking to identify and address potential PR issues before they escalate, protecting brand equity.
Comparison of 10 Data Analysis Reports
| Report Type | Implementation Complexity 🔄 | Resource Requirements ⚡ | Expected Outcomes 📊 | Ideal Use Cases 💡 | Key Advantages ⭐ |
|---|---|---|---|---|---|
| Sales Performance Analysis Report | Medium — CRM + forecasting integration; periodic refresh | Moderate — sales data, BI tools, data quality processes | Revenue visibility, pipeline health, improved forecasting | Sales ops, regional performance reviews, pricing strategy | Identifies top products/regions; enables data-driven decisions |
| Customer Behavior Analytics Report | High — cross-touchpoint tracking + ML models | High — large behavioral datasets, ML/data science expertise | Churn prediction, personalized experiences, higher retention | E‑commerce, subscription services, personalization initiatives | Improves retention and targeting; enables personalization |
| Marketing Campaign Performance Report | Medium‑High — multi‑channel attribution and testing | Moderate — tag management, analytics platforms, A/B testing | Optimized spend, improved ROI, clearer channel performance | Campaign optimization, budget allocation, channel mix tests | Measures campaign effectiveness; guides budget allocation |
| Financial Data Analysis Report | High — strict accounting integration and compliance | Moderate‑High — accounting systems, finance team, audit controls | Financial transparency, budgeting, investor-ready reports | Budgeting, forecasting, investor relations, cost control | Supports strategic planning and financial governance |
| Website Analytics and User Experience Report | Medium — tagging, session capture, heatmaps | Moderate — analytics tools, UX resources, dev support | Better UX, higher conversion rates, reduced friction | Conversion rate optimization, redesigns, content strategy | Reveals usability issues and conversion blockers |
| Human Resources and Employee Analytics Report | Medium — HRIS integration, anonymization needs | Moderate — HR data, analytics, compliance controls | Improved retention, optimized hiring, diversity insights | Talent management, succession planning, D&I programs | Identifies retention drivers; reduces hiring costs |
| Supply Chain and Inventory Analytics Report | High — multi‑system integration and forecasting | High — logistics data, forecasting models, supplier KPIs | Lower carrying costs, fewer stockouts, improved lead times | Retail, manufacturing, logistics optimization | Improves delivery performance and inventory efficiency |
| Product Analytics and Usage Report | Medium‑High — event instrumentation and cohort tooling | Moderate — event tracking, analytics platform, product team | Feature adoption insights, improved onboarding, roadmap signals | SaaS product teams, feature launches, retention efforts | Guides product decisions and increases engagement |
| Healthcare and Medical Data Analysis Report | High — clinical data integration, strict privacy (HIPAA) | High — EHR systems, clinical expertise, compliance controls | Better patient outcomes, operational efficiency, evidence support | Hospitals, clinical trials, quality improvement programs | Improves care quality and supports clinical decisions |
| Social Media and Content Analytics Report | Medium — API integrations, NLP for sentiment | Moderate — monitoring tools, content/creative teams | Improved engagement, brand sentiment tracking, audience growth | Brand monitoring, content strategy, influencer campaigns | Measures awareness and sentiment; optimizes content |
From Analysis to Advantage: The Visbanking Mandate
The diverse examples of data analysis reports we have explored, from Sales Performance to Financial Risk, share a common thread: they are the mechanisms that convert raw data into strategic capital. For bank executives, these are not mere historical summaries; they are forward-looking instruments essential for navigating a competitive and highly regulated landscape. The ability to dissect a marketing campaign's ROI or model the impact of macroeconomic shifts on your loan portfolio is no longer a niche skill—it is a fundamental requirement for leadership and institutional survival.
What separates market-leading banks is not the volume of data they collect, but the velocity at which they can synthesize it, extract insight, and execute decisions. A fragmented approach, relying on siloed departmental reports and lagging indicators, creates an unacceptable level of operational risk and missed opportunities. The true mandate for modern banking is to build an integrated intelligence ecosystem where every critical data point informs the next strategic move.
The Shift from Reactive Reporting to Proactive Intelligence
The most powerful takeaway from these report examples is the evolution from reactive analysis to proactive strategy.
- From Past Performance to Future Prediction: A strong financial analysis report does not just detail last quarter's net interest margin. It uses trend analysis and market data to project the next two quarters, identifying specific levers, such as deposit pricing or commercial loan origination, that can be adjusted to meet targets.
- From Customer Segments to Individual Needs: Advanced customer behavior reports move beyond broad demographics. They use transactional and behavioral data to pinpoint opportunities for personalized product offerings, preemptively address churn risks, and tailor communication for maximum impact, driving both loyalty and wallet share.
- From Departmental Silos to Enterprise-Wide Vision: Each report, whether from HR, marketing, or operations, contributes to a holistic understanding of the bank's health. The true advantage comes from integrating these disparate views. For instance, connecting employee performance data with sales outcomes can reveal which training programs deliver the highest return on investment.
This integrated approach transforms data from a reporting burden into your institution's most valuable asset. It underpins every critical decision, from allocating capital and managing risk to optimizing talent and outmaneuvering competitors. The ultimate goal is to create a culture where data-driven insights are not just reviewed in a boardroom but are embedded in the daily workflows of every team. Mastering the creation and interpretation of these reports is the first step toward achieving that unified, intelligent, and decisive operational model.
The examples of data analysis reports in this article highlight the need for a unified data foundation. Visbanking provides the Bank Intelligence and Action System (BIAS) that integrates disparate data sources, empowering your team to move from observation to execution with speed and confidence. Benchmark your performance and command your future by visiting Visbanking to see how our platform transforms data into your competitive advantage.
Related Articles

Visbanking Blog
Visbanking: Leading Financial Intelligence for Banks

Visbanking Blog
Revolutionize Your Bank's Performance with BIAS: Unlocking the Future of Visual Banking Data

Visbanking Blog
Make More Informed Decisions with BIAS, the Data-Driven Banking Solution

Visbanking Blog
Revolutionize Your Banking Operations with Data-Driven Insights from BIAS

Visbanking Blog
Exploring US Banks: A Deep Dive into the Visbanking Banking Report Portal

Visbanking Blog