Understanding the Efficiency Ratio Formula for Banks
Brian's Banking Blog
At its core, the efficiency ratio formula for banks is simple: Non-Interest Expenses divided by Total Revenue. This one number tells you exactly how much a bank has to spend to generate a single dollar of income.
Think of it as a bank's report card on running a tight ship. It's a fundamental measure of operational fitness.
What the Efficiency Ratio Reveals About a Bank
Imagine you own a coffee shop. For every dollar you make selling lattes, how many cents do you spend on beans, rent, and your baristas' salaries? That's precisely what the efficiency ratio tells you about a bank. It’s a direct look into its cost control and overall health.
A lower ratio is almost always a good sign. It means the bank is operating lean, keeping its overhead—like salaries, tech costs, and rent—well under control relative to the money it's bringing in.
On the other hand, a high or climbing ratio can be a red flag. It might suggest that expenses are spiraling upwards faster than revenue, which is a trend no one wants to see.
The big idea is straightforward: a more efficient bank gets to keep more of every dollar it earns. This is why investors, analysts, and bank managers themselves rely on this metric for a quick, yet powerful, snapshot of expense discipline. You can dive deeper into what the efficiency ratio tells you about a bank and how it shapes performance.
The Formula's Key Ingredients
To really get a handle on the efficiency ratio, you need to know its two main components. These numbers are pulled straight from a bank's income statement and form the backbone of the entire calculation.
As a general rule of thumb, an efficiency ratio of 50% or below is considered top-tier performance. For more on this, Wall Street Prep offers great insights on banking performance metrics.
To make it crystal clear, let's break down each piece of the formula.
Breaking Down the Bank Efficiency Ratio Formula
This table unpacks what goes into the calculation, showing you where to find these figures and what they truly mean for the bank's operations.
| Formula Component | What It Represents | Common Examples from Financials |
|---|---|---|
| Non-Interest Expenses | These are all the costs of running the bank, not including the interest it pays out on deposits. It’s the bank's overhead. | Salaries and employee benefits, rent and building maintenance, technology spending, marketing, and legal fees. |
| Total Revenue | This is the total income a bank generates from all its activities before expenses. | Net Interest Income (the spread earned on loans) plus Non-Interest Income (fees from services, wealth management, etc.). |
Essentially, you're comparing the bank's operating costs to its total operational earnings. It's a direct measure of how effectively management is turning revenue into profit.
Alright, let's get down to brass tacks. You have the formula for a bank's efficiency ratio, but how do you actually calculate it without getting buried in a hundred-page financial statement?
It’s simpler than you might think. The whole thing boils down to just two numbers from the income statement: what the bank spends to run its operations and what it earns in total. Let’s walk through finding them.
Step 1: Pin Down Your Non-Interest Expenses
First, you need to find the bank's non-interest expenses. This is everything it costs to keep the doors open and the lights on—all the overhead that isn't related to the interest paid out on deposits. Think of it as the bank's total operating bill.
You're looking for line items like:
- Salaries and employee benefits
- Rent, utilities, and building maintenance
- Tech and software costs
- Marketing and advertising spend
- Legal and professional fees
This number gives you a clear picture of the bank's operational cost structure before you even consider its core business of lending and borrowing.
Step 2: Tally Up the Total Revenue
Next, you need to figure out what the bank actually earned. This isn't just one number; it’s the sum of two very different income streams that together show the bank's full earning power.
You'll add these two together:
- Net Interest Income: This is the classic banking profit—the interest earned from loans minus the interest paid out to depositors.
- Non-Interest Income: This is all the money coming in from fees and other services. Think account maintenance fees, wealth management services, or loan origination charges.
Putting these two together gives you the bank's total revenue. If you want to dig deeper into how these numbers fit into the bigger picture, our guide on financial statement analysis for banks is a great place to start.
The infographic below shows how a financial pro would tackle this calculation, breaking it down into simple, manageable pieces.
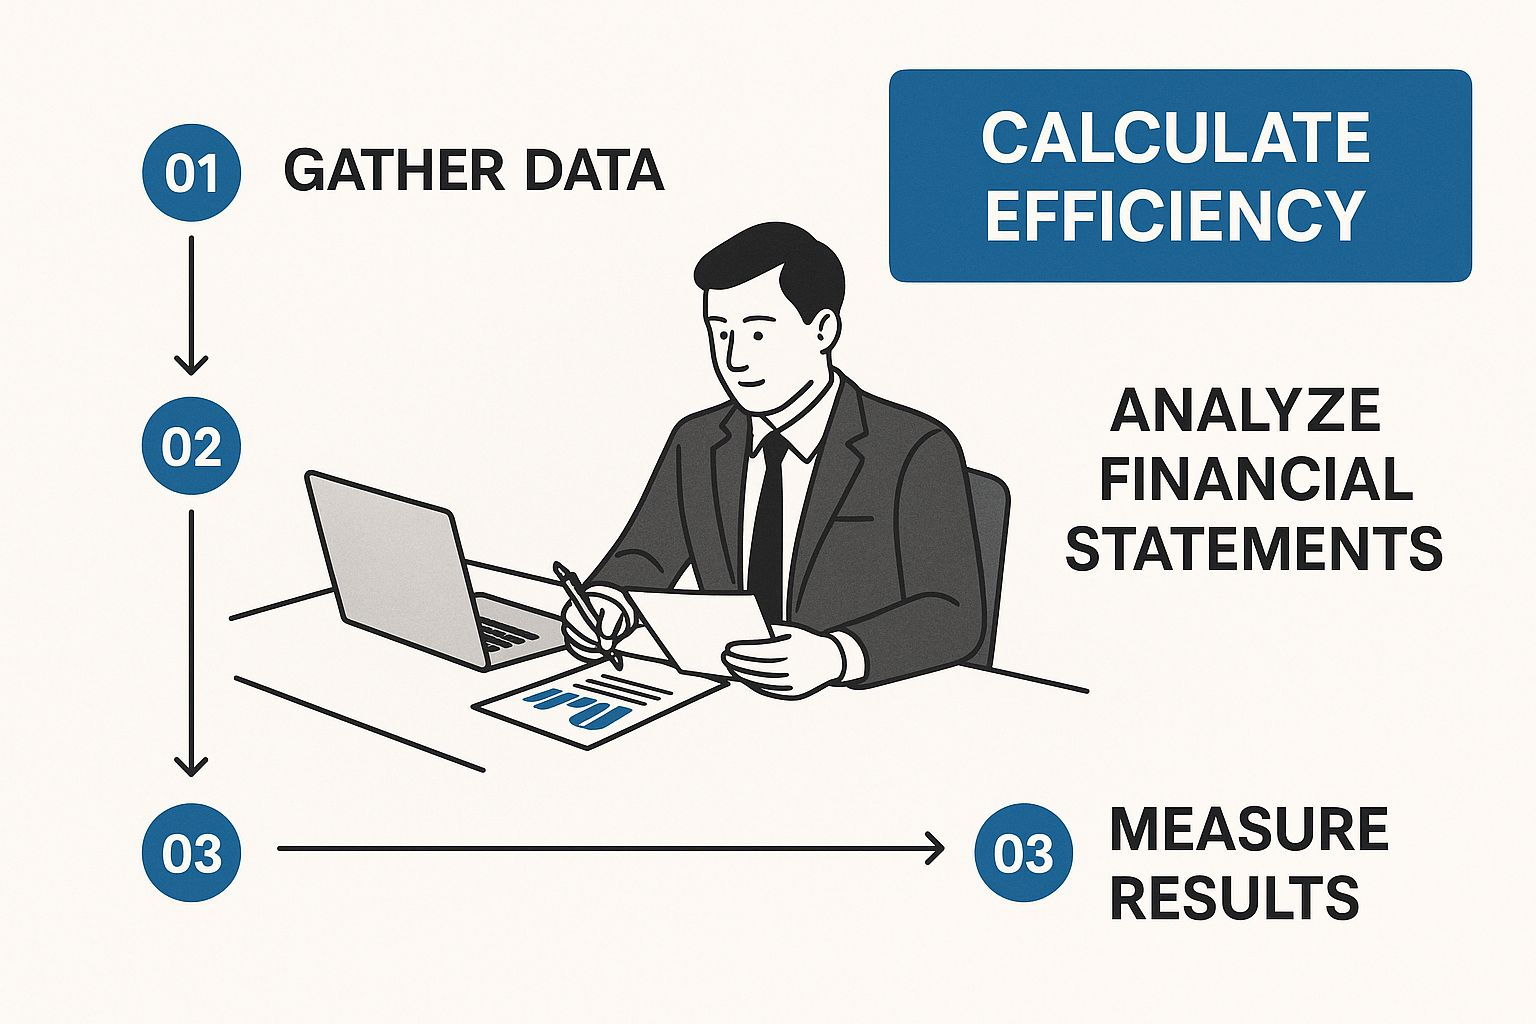
As you can see, the key is to correctly separate the operational costs from the total revenue generated. Once you have those, you're ready for the final step.
Step 3: Do the Math
With both figures in hand, the rest is just simple arithmetic. You just plug them into the efficiency ratio formula:
Efficiency Ratio = Non-Interest Expenses / Total Revenue
Let’s run a quick example. Say a bank has $60 million in non-interest expenses for the quarter and brought in $100 million in total revenue.
The math looks like this:
$60,000,000 / $100,000,000 = 0.60
To get the percentage, just multiply by 100. The bank's efficiency ratio is 60%. In plain English, this means it costs that bank 60 cents to make every single dollar of revenue.
What a Good Efficiency Ratio Actually Looks Like

So you've got the number. Now what? The calculation is the easy part—the real magic happens when you interpret what it's telling you. While the golden rule is "the lower, the better," what qualifies as a "good" efficiency ratio isn't set in stone. It really hinges on a bank's specific strategy and business model.
As a general rule of thumb, an efficiency ratio dipping below 50% is considered top-tier. Think about it: that means the bank is spending less than 50 cents to generate every single dollar of revenue. That’s a hallmark of a lean, mean, profit-making machine.
On the flip side, if the ratio starts creeping up past 70%, it’s time to pay attention. This suggests that expenses are eating up a huge chunk of income, which can squeeze profits and might point to some operational fat that needs trimming.
Context Is Everything
But here's the thing: you can't just slap these benchmarks on every bank and call it a day. The right number for one institution could be a major red flag for another. Context is king.
For example, a traditional community bank focused on Main Street lending will have a completely different cost structure than a global investment bank that needs to pay for high-flying traders and cutting-edge tech. Their "good" ratios will look very different.
Likewise, a bank that's in a major growth spurt—investing heavily in new branches or a digital banking platform—might see its ratio spike temporarily. That's not necessarily a bad thing, especially if those investments are setting the stage for future growth and even greater efficiency down the road.
A single efficiency ratio is just a snapshot. A picture in time. The real story unfolds when you look at the trend. A ratio that's slowly but consistently ticking upward is a far bigger warning sign than one static number.
Tracking the Trend Over Time
Watching this metric over several quarters or years gives you a much clearer picture of a bank’s operational health. It helps answer the big questions about how effective the management team is and whether the bank is built for the long haul.
- Is the trend pointing down? That's great news. It usually means cost-control efforts are working or revenue is growing faster than expenses.
- Is the trend heading up? This could signal trouble. It might point to falling revenue, runaway spending, or operational hiccups that need to be addressed, and fast.
By analyzing the direction the ratio is moving, you can tell the difference between a one-off bad quarter and a fundamental problem in the bank’s operating model. That’s what makes it such a powerful tool for looking ahead.
Seeing the Bank Efficiency Ratio in the Real World
Alright, let's get out of the textbook. The efficiency ratio formula really starts to make sense when you see how it behaves in the wild with real banks. Seeing the numbers move tells a story that a simple definition never could.
When you see a bank's ratio jump, you have to ask: did revenue suddenly take a nosedive? Or did expenses get out of control? The answers to those questions reveal how a bank's big decisions—like pouring money into a new app or shutting down branches—show up on the bottom line. This is how you go from just knowing the formula to actually understanding the banks you see in the news.
Case Study: Watching Performance Shift
Think about a major bank trying to navigate a rough patch in the economy. In that kind of environment, even tiny shifts in what's coming in versus what's going out can make a huge difference.
Take Wells Fargo, for example. In 2019, they reported an efficiency ratio of 68.4%. That was a noticeable jump from 65.2% the year before. The reason? Their total income dipped by 1.1% while their operating expenses crept up by 3.7%. This is a classic case of how a bank's mostly fixed costs mean even a small revenue hiccup can make the efficiency ratio look a lot worse. You can dig deeper into these kinds of FIG metrics to see how they connect.
A rising efficiency ratio isn't just a number. It’s a red flag. It means the bank is having to spend more and more to earn every single dollar. That could be a strategic investment, or it could be a sign of real operational stress.
This is exactly why looking at one number in isolation is a rookie mistake. You have to be a detective and find the "why" behind the change. Was the bank spending big on a digital overhaul that promises future savings? Or was it just struggling with fewer people paying fees? Getting that context is what turns the efficiency ratio from a simple math problem into a seriously powerful tool for analysis.
For bank leaders, the efficiency ratio isn't just another number on a spreadsheet. It's the pulse of the operation, a critical tool they use to steer the entire ship. The savviest executives rely on this metric to make tough calls that will define the bank's future, from setting department budgets to green-lighting major strategic projects.
A healthy efficiency ratio sends a powerful signal to the market. Investors and rating agencies keep a close eye on this figure because it's a direct reflection of how effectively management is running the show. A consistently low or improving ratio can do wonders for shareholder confidence and signal real, long-term stability.
Setting Performance Goals
Internally, the efficiency ratio is a cornerstone for managing performance. Leaders use it to set clear, data-driven targets for keeping costs in check across the organization. This allows them to benchmark their bank's performance against direct competitors, quickly seeing where they have an edge and where they're falling behind.
This kind of strategic benchmarking is absolutely vital. A bank might, for instance, use the ratio to realize it's overspending on physical branches compared to a nimbler, more digitally-focused rival.
The real goal here is to drive profitability. Improving the efficiency ratio by just a few percentage points can mean hundreds of millions of dollars in cost savings or new income for the big players. This is often done through smart digitization and optimizing the branch network. You can find out more about how these management strategies impact financial institutions.
Guiding Major Investments
When a bank is thinking about a huge investment—like a complete digital overhaul or a new tech platform—the efficiency ratio is front and center in the business case. Management has to prove that the upfront cost will pay off by creating more efficiency and trimming operating expenses down the road.
If the project is a success, you'll see it in the numbers. The ratio should improve, proving the investment was worth it. Of course, this metric doesn't exist in a vacuum; it's tied to other key indicators and can be swayed by the wider economy. For a deeper dive, you can explore the impact of interest rates on bank profitability to see how these outside forces shape decisions inside the bank.
Got Questions? Let's Talk Bank Efficiency Ratios.

Once you start using the bank efficiency ratio, you'll naturally run into a few tricky questions. It's one thing to know the formula, but another to apply it wisely in the real world. Let's clear up some of the most common points of confusion so you can sidestep the usual analytical traps.
Here are some quick answers to sharpen your understanding.
Can a Bank Efficiency Ratio Actually Be Too Low?
It sounds a bit backward, doesn't it? But yes, an extremely low efficiency ratio can be a red flag. While a low number is what you're aiming for, one that seems almost too perfect might mean a bank is cutting corners on its future.
Think about it. A bank could be pinching pennies by:
- Sticking with old tech: Putting off system upgrades saves a buck today but can leave you in the dust competitively tomorrow.
- Being cheap with talent: Underpaying your team or skipping out on training will eventually catch up to you in the form of poor service and a lack of new ideas.
- Skimping on compliance: This is a dangerous game. Ignoring risk management is a gamble that can lead to some seriously expensive fines down the line.
When you see a suspiciously low ratio, it's time to dig deeper. Is the bank genuinely efficient, or is it just robbing its future to prop up today's numbers?
How Is This Different from ROA or ROE?
Great question. While all three are vital signs of a bank's health, they tell very different stories. The efficiency ratio is laser-focused on one thing: operational cost control. How much does it cost you to make a dollar?
In contrast, the other two look at the results of those operations:
- Return on Assets (ROA): This tells you how well a bank is using its assets—like loans and investments—to make a profit. It answers, "How much profit are we squeezing out of every dollar in assets?"
- Return on Equity (ROE): This is a big one for investors. It shows how much profit the bank is creating for every dollar of shareholder equity.
Here’s a simple way to look at it: The efficiency ratio is about how you run the ship day-to-day. ROA and ROE are about the destination you reach from the perspective of your assets and your owners. Using them together gives you a much clearer, more complete picture of what's really going on.
Ready to stop guessing and start knowing? Visbanking delivers the Bank Intelligence and Action System (BIAS) to help you see exactly how you stack up against your peers. Benchmark performance, spot your next big opportunity, and make decisions with data-backed confidence. Find your edge at https://www.visbanking.com.
Latest Articles

Brian's Banking Blog
What Is Concentration Risk? a Guide for Bank Executives

Brian's Banking Blog
What Does Beat the Market Mean: A Guide for Financial

Brian's Banking Blog
Housing Market Analysis: Drive Lending Decisions

Brian's Banking Blog
What Is Agentic Workflow: Transforming Banking in 2026

Brian's Banking Blog
How to Improve Retention: Data-Driven Strategies 2026

Brian's Banking Blog